Touches in the paint
Zubac16.3
Typical center9.5
Upper 10% of 46 centers by frequency

2026-27 · Regular season
11 games · INDCompared with 2026-27 centers. “Typical” is the middle player. Scoring, assists, rebounds and minutes show volume.
Touches in the paint · 16.3 per 36 minutes, compared with 9.5 for a typical center. See how Zubac plays ↓
2026-27 regular season · 11 games
Game impact in points of scoreboard margin. Positive adds to his team’s margin.
Select a game for the box score and impact breakdown.
Over his last five games, Zubac averaged +0.4 impact points per game, above his season average of -1.0.
2026-27 regular season · 11 games
Two-pointers accounted for 82.4% of Zubac’s 119 points.
| Shot type | Accuracy | Attempts |
|---|---|---|
| Two-pointers82.4% of points | 57.6%Median 61.1% | 85 |
| Three-pointers0.0% of points | — | 0 |
| Free throws17.6% of points | 75.0%Median 73.2% | 28 |
Medians compare centers with at least 10 games and 25 attempts of that shot type.
True shooting · 61.1%Middle half · typical 61.4%Scoring efficiency across twos, threes and free throws.
Effective field goal · 57.6%Middle half · typical 59.7%Field-goal accuracy with extra credit for the third point on a three.
The morning read
Every Indiana Pacers game in your inbox the next morning at 8 a.m. Eastern, with quarter scores, how long each team led and the top players by Game impact.
You're in.
The morning read goes to at 8 a.m. Eastern after the next night of games.
Free. Unsubscribe in one click. Join 673 people who have already signed up.
Read the Game / 2026-27 regular season
90% sampling interval -3.6 to -1.0
11 recorded games · 260 minutes with reconciled lineups.
Separate offense and defense estimates, adjusted for lineup context.
Positive offense means more points scored than average. Positive defense means more points prevented. Spacing uses shooting threat, not direct gravity. Defensive estimates do not isolate every assignment or off-ball action.
Percentile bands compare 331 players with at least 100 verified minutes in this model release. Zero is the minutes-weighted league average. This estimates player strength in the observed role; it is not points caused or a guarantee over starter minutes. Short samples borrow more from prior seasons and the league. Intervals measure sampling variation conditional on the recorded features.
Games through 2026-11-21 · 7 of 10 tracking families observed · opportunity-adjusted-impact-v3 · Data & source coverage ↗
Compare the credit ESPN assigns Zubac for scoring, creating shots, rebounding and defense per 100 possessions.

2026-27 / Regular season
7 games · 23.0 MPG · 161.0 minutes
All axes run from 0 to 100. The halfway ring marks the 50th percentile.
Select a skill to see its Net Points and league average.
Closest profiles by equal-weight distance across all 20 skill percentiles. This describes statistical similarity, not the same role, style or ceiling. Lower distance means a closer profile.
ESPN’s Net Points model assigns offensive and defensive credit from game events. These are attributed ESPN estimates, separate from RTG’s Game impact. Adding the two would count shared evidence twice.
Percentiles compare published players in the same season who meet your minutes threshold. Ties receive their midpoint rank. We require at least 20 available values per skill; missing values stay unavailable. The league mean is the arithmetic average of player rates, not the 50th percentile. “League impact spread” sorts by the highest minus lowest rate in that pool. “Player strengths” sorts by percentile, or by rate above the league mean in the Net Points view.
Only source samples reconciled to official NBA identities, games and minutes enter this view. The league pool excludes withheld or unavailable profiles. A subject below your minutes threshold is still shown against the qualifying pool and explicitly marked. A previous-season comparison uses that season’s own pool at the same minutes threshold.
These event-based estimates do not fully measure spacing, off-ball deterrence, screen navigation or defensive assignments. Turnover cost is affected by offensive responsibility. Defensive field-goal credit is a model estimate, not a shooting percentage. A short-sample rank is not an ability forecast.
336.7 ESPN possessions · sample through 2026-11-11 · source checked 2026-11-22 14:14 UTC.
2026-27 · 11 games · 260 recorded minutes. Percentiles compare 412 eligible NBA players from 2025-26.
Points per 36 minutes
Assists per 36 minutes; does not measure every advantage created
Rebounds per 36 minutes; role and available rebounds matter
Percentage of field-goal attempts taken from three
Free-throw attempts per 100 field-goal attempts
True shooting percentage, weighted by attempts
Players in the comparison group played at least 20 games and 300 minutes and took 100 shots from the field. Zubac needs 100 minutes and 30 shots to receive a percentile. Early in the season, the comparison uses the previous season’s qualifying players.
NBA source record ↗2026-27 · 73 attempts in 10 checked games
Bars show each zone’s share of attempts. The rim is under 4 feet, short twos are 4 to under 14 feet, and long twos start at 14 feet. Three-pointers follow NBA event labels.
Shot logs match the box score in 10 of the last 10 appearances. Teammates assisted 66.7% of his made shots in those games.
2026-11-20 vs CLE ↗ 2026-11-18 vs HOU ↗ 2026-11-15 vs PHI ↗ 2026-11-13 vs NYK ↗ 2026-11-11 vs WAS ↗ 2026-11-09 vs DAL ↗ 2026-11-07 vs DEN ↗ 2026-11-04 vs MEM ↗ 2026-10-25 vs BKN ↗ 2026-10-23 vs DAL ↗Current IND teammates with an overlapping listed position. Averages are from 2026-27.
| Player | Position | MIN / G | AST / G | 3P% | 3PA | REB / G |
|---|---|---|---|---|---|---|
| Jay Huff ↗ | C | 15.5 | 0.8 | 32.5% | 40 | 3.0 |
| Larry Nance Jr. ↗ | F-C | 13.5 | 0.6 | 38.9% | 36 | 2.3 |
2026-27 / NBA tracking
Tracked actions per 36 minutes
Upper 10% of 46 centers by frequency
Lower 10% of 45 centers by frequency
Middle half of 46 centers by frequency
When he defended the shot Opponents shot 44.3% with Zubac closest, compared with their usual 50.9%. 115 tracked attempts. Help defense and shot mix matter.
Typical is the median for centers in the same season.
A screen assist is a pick that leads directly to a teammate’s basket.
11 tracked games · NBA source · 2026-11-22 ↗
A contested rebound is secured with an opponent nearby.
10 tracked games · NBA source · 2026-11-22 ↗
Drive frequency describes how often he attacks off the dribble. Fewer turnovers per drive means he keeps the ball more often.
10 tracked games · NBA source · 2026-11-22 ↗
Touches show where and how often he gets the ball.
10 tracked games · NBA source · 2026-11-22 ↗
A pass leading to a shot counts even when the shooter misses.
10 tracked games · NBA source · 2026-11-22 ↗
A negative gap means opponents shot worse than their usual percentage with him as the closest defender. Help defense and shot mix also matter.
11 tracked games · NBA source · 2026-11-22 ↗
The NBA has no qualifying shot-quality sample for Zubac.
Each comparison uses the same season and NBA feed. Count rates require five games and 100 tracked minutes. Drive turnovers also require 20 drives. Shooting comparisons need 25 attempts and NBA gravity and leverage scores need five games. Each group needs at least 20 eligible players. Ties share their place.
490 tracked partial possessions through 2026-11-21. Scoring rates use this season and half of last season. The difference compares his own assignments with everyone he shared the floor with, so it does not rise just because he plays against starters.
This measures the scoring load of his opponents. How it is measured · League ranking
Eight largest recorded matchup samples at most. Partial possessions are tracking assignments, not completed possessions for RAPM. Opponent shooting is affected by help, shot mix and sample size.
| Opponent | Minutes | Partial possessions | Opponent FG% | Attempts |
|---|---|---|---|---|
| Daniel Gafford | 10.0 | 46.7 | 50.0% | 4 |
| Yves Missi | 8.3 | 46.5 | 100.0% | 3 |
| Anthony Davis | 7.5 | 33.2 | 27.3% | 11 |
| Jarrett Allen | 5.5 | 33.2 | 0.0% | 1 |
| Karl-Anthony Towns | 6.7 | 28.9 | 33.3% | 9 |
| Zach Edey | 5.2 | 22.4 | 66.7% | 3 |
| Jabari Walker | 4.0 | 18.7 | 100.0% | 3 |
| Steven Adams | 4.2 | 15.7 | 50.0% | 2 |
| Season | Team | GP | MIN | PTS | REB | AST | STL | BLK | FG% | 3P% | FT% |
|---|---|---|---|---|---|---|---|---|---|---|---|
| 2026-27 | IND | 11 | 23.7 | 10.8 | 8.1 | 1.9 | 0.0 | 0.9 | 57.6% | — | 75.0% |
| 2025-26 | IND / LAC | 48 | 30.2 | 14.1 | 10.6 | 2.2 | 0.4 | 0.8 | 59.8% | — | 71.1% |
| 2024-25 | LAC | 80 | 32.8 | 16.8 | 12.6 | 2.7 | 0.7 | 1.1 | 62.8% | — | 66.1% |
| 2023-24 | LAC | 68 | 26.4 | 11.7 | 9.2 | 1.4 | 0.3 | 1.2 | 64.9% | — | 72.3% |
| 2022-23 | LAC | 76 | 28.5 | 10.8 | 9.9 | 1.0 | 0.4 | 1.3 | 63.4% | 0.0% | 69.7% |
| 2021-22 | LAC | 76 | 24.4 | 10.3 | 8.5 | 1.6 | 0.5 | 1.0 | 62.6% | — | 72.7% |
| 2020-21 | LAC | 72 | 22.3 | 9.0 | 7.2 | 1.2 | 0.3 | 0.9 | 65.2% | 25.0% | 78.9% |
| 2019-20 | LAC | 72 | 18.4 | 8.3 | 7.5 | 1.1 | 0.2 | 0.9 | 61.3% | 0.0% | 74.7% |
| 2018-19 | TOT | 59 | 17.6 | 8.9 | 6.1 | 1.1 | 0.2 | 0.9 | 55.9% | — | 80.2% |
| 2018-19 | LAL | 33 | 15.6 | 8.5 | 4.9 | 0.8 | 0.1 | 0.8 | 58.0% | — | 86.4% |
| 2018-19 | LAC | 26 | 20.2 | 9.4 | 7.7 | 1.5 | 0.4 | 0.9 | 53.8% | — | 73.3% |
| 2017-18 | LAL | 43 | 9.5 | 3.7 | 2.9 | 0.6 | 0.2 | 0.3 | 50.0% | 0.0% | 76.5% |
| 2016-17 | LAL | 38 | 16.0 | 7.5 | 4.2 | 0.8 | 0.4 | 0.9 | 52.9% | 0.0% | 65.3% |
| Competition | Game | FG% | 3P% | FT% | ||||||||
|---|---|---|---|---|---|---|---|---|---|---|---|---|
| Season avg · 11 games | -1.0 | 23.7 | 10.8 | 8.1 | 1.9 | 0.0 | 0.9 | 57.6% | — | 75.0% | ||
| Nov 20 | Regular season | IND vs CLE ↗ | +3.1 | 27.3 | 21 | 10 | 2 | 0 | 3 | 72.7% | — | 83.3% |
| Nov 18 | Regular season | IND vs HOU ↗ | -4.4 | 23.8 | 4 | 3 | 4 | 0 | 1 | 50.0% | — | — |
| Nov 15 | Regular season | IND vs PHI ↗ | -3.6 | 22.2 | 8 | 5 | 2 | 0 | 0 | 50.0% | — | 100.0% |
| Nov 13 | Regular season | IND vs NYK ↗ | +4.0 | 25.8 | 12 | 13 | 1 | 0 | 1 | 50.0% | — | — |
| Nov 11 | Regular season | IND vs WAS ↗ | +2.8 | 31.4 | 20 | 12 | 1 | 0 | 2 | 60.0% | — | 100.0% |
| Nov 9 | Regular season | IND vs DAL ↗ | -2.0 | 27.6 | 16 | 3 | 0 | 0 | 0 | 71.4% | — | 75.0% |
| Nov 7 | Regular season | IND vs DEN ↗ | +1.8 | 19.0 | 10 | 12 | 5 | 0 | 0 | 80.0% | — | 100.0% |
| Nov 4 | Regular season | IND vs MEM ↗ | -9.0 | 18.8 | 1 | 4 | 2 | 0 | 0 | 0.0% | — | 50.0% |
| Oct 25 | Regular season | IND vs BKN ↗ | -0.5 | 7.0 | 2 | 1 | 2 | 0 | 0 | 100.0% | — | — |
| Oct 23 | Regular season | IND vs DAL ↗ | -3.9 | 23.6 | 9 | 11 | 2 | 0 | 1 | 57.1% | — | 50.0% |
| Oct 21 | Regular season | IND vs NOP ↗ | +1.2 | 33.6 | 16 | 15 | 0 | 0 | 2 | 58.3% | — | 50.0% |
| Oct 16 | Preseason | IND vs MIL ↗ | — | 19.8 | 11 | 11 | 2 | 1 | 1 | 62.5% | — | 50.0% |
| Oct 13 | Preseason | IND vs OKC ↗ | — | 18.0 | 13 | 13 | 5 | 3 | 0 | 85.7% | — | 100.0% |
| Oct 10 | Preseason | IND vs ATL ↗ | — | 20.8 | 11 | 5 | 2 | 1 | 1 | 66.7% | — | 50.0% |
| Oct 7 | Preseason | IND vs MIN ↗ | — | 17.6 | 6 | 3 | 2 | 1 | 0 | 42.9% | — | — |
No games match these filters.
Game impact measures points added to the team’s margin in a single game. A dash indicates an unavailable figure.
NBA tracking covers 11 games this season. Boxed values mark season highs.
| Date | Game | TCH | 2AST | CONT | DEFL | LOOSE | BOX | SCR | RIM D |
|---|---|---|---|---|---|---|---|---|---|
| Nov 20 | IND vs CLE | 41 | 0 | 6 | 0 | 2 | 2 | 2 | 50.0% · 2 att. |
| Nov 18 | IND vs HOU | 40 | 0 | 6 | 1 | 0 | 0 | 1 | 50.0% · 6 att. |
| Nov 15 | IND vs PHI | 26 | 0 | 7 | 1 | 0 | 0 | 3 | 100.0% · 1 att. |
| Nov 13 | IND vs NYK | 31 | 0 | 7 | 0 | 0 | 2 | 1 | 100.0% · 1 att. |
| Nov 11 | IND vs WAS | 45 | 0 | 10 | 1 | 0 | 0 | 1 | 0.0% · 2 att. |
| Nov 9 | IND vs DAL | 33 | 1 | 2 | 0 | 0 | 0 | 1 | 66.7% · 3 att. |
| Nov 7 | IND vs DEN | — | — | 8 | 0 | 0 | 2 | 2 | — |
| Nov 4 | IND vs MEM | 37 | 0 | 2 | 0 | 0 | 3 | 2 | 100.0% · 2 att. |
| Oct 25 | IND vs BKN | 7 | 0 | 2 | 0 | 0 | 0 | 0 | 66.7% · 3 att. |
| Oct 23 | IND vs DAL | 52 | 0 | 8 | 0 | 0 | 3 | 2 | 20.0% · 5 att. |
| Oct 21 | IND vs NOP | 49 | 0 | 11 | 0 | 0 | 5 | 3 | 80.0% · 10 att. |
Source: NBA tracking, hustle and matchup box scores, checked after each final and again once corrections settle. A dash means the league did not publish that count for the game. These counts describe a game. They are not part of Game impact or Full impact.
Regular season
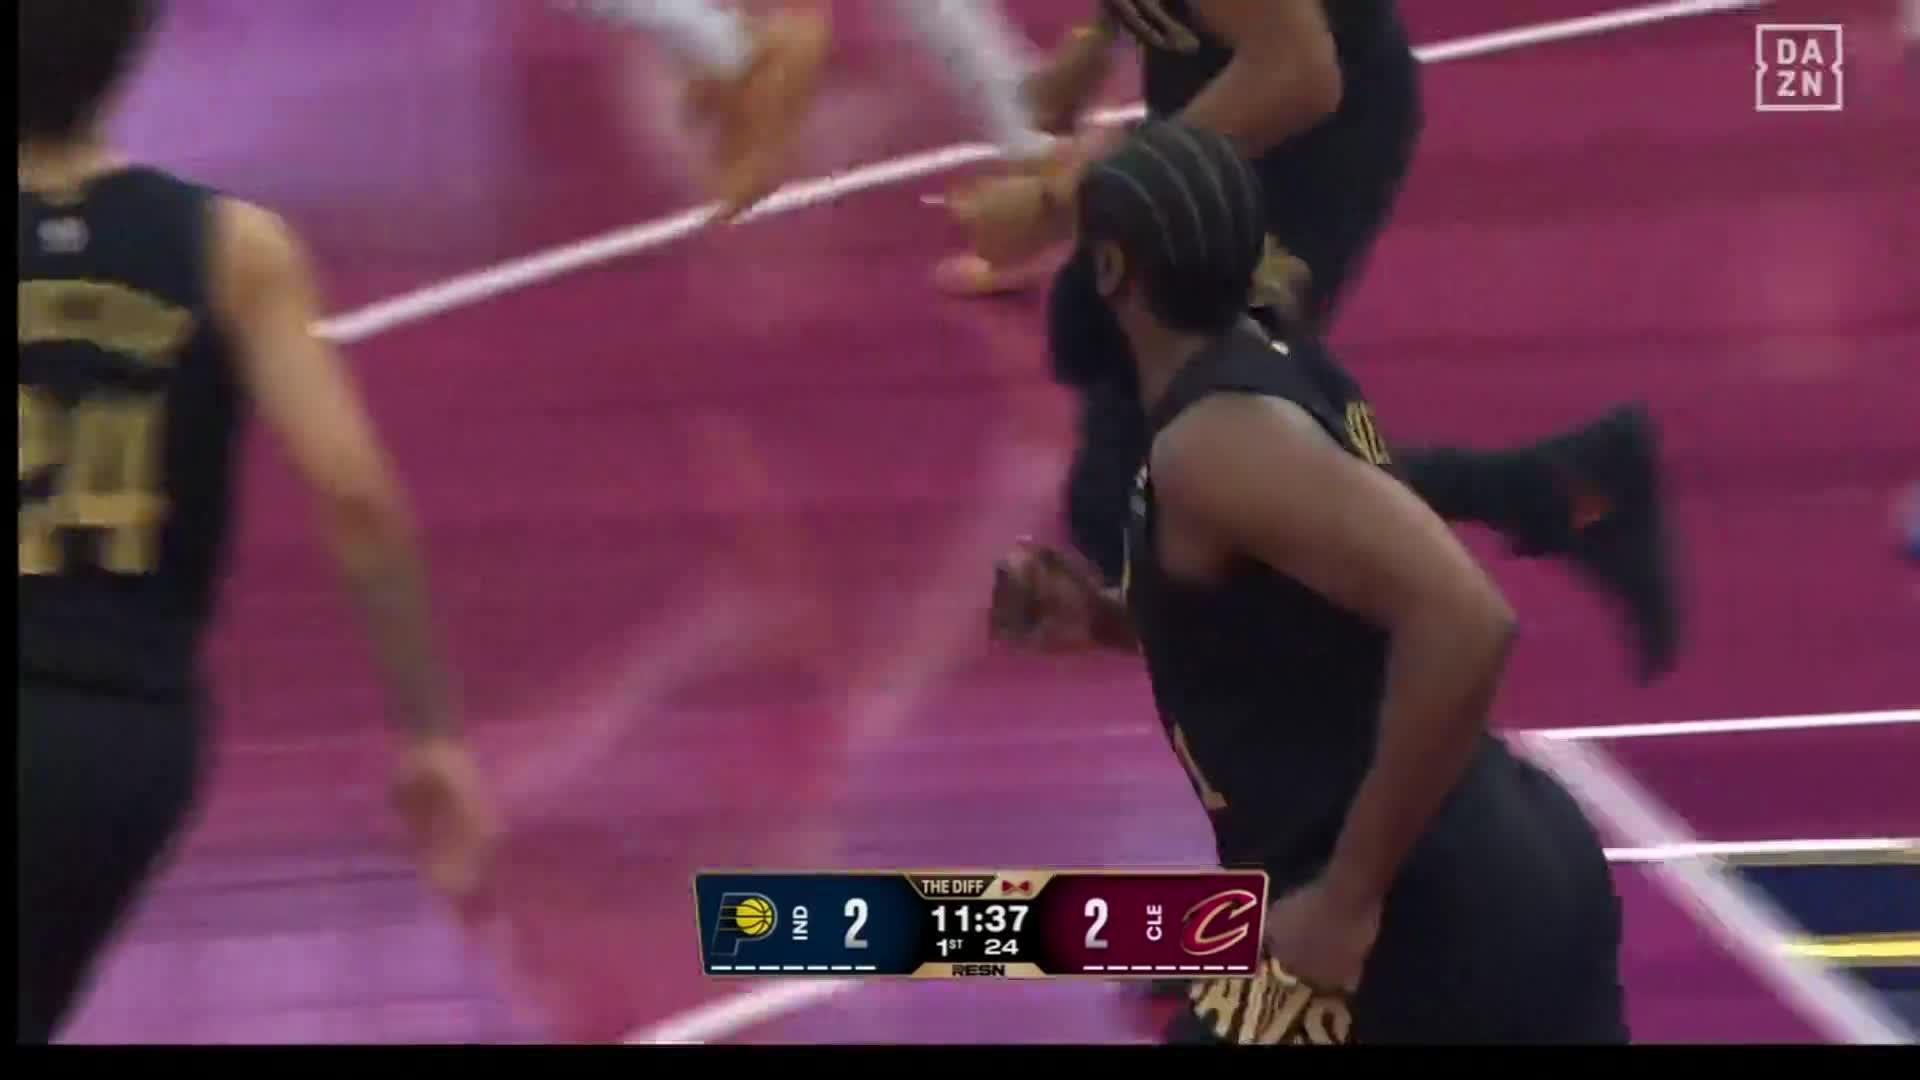
Nov 20, 2026 · IND vs CLE
Starter · 27.3 minutes
Ivica Zubac shared the team scoring lead with 21 points, shooting 72.7% from the field. He shot 83.3% at the line on 6 attempts. He added 3 blocks and 10 rebounds.
Box-score read
Game impact+3.07
Regular season
Nov 18, 2026 · IND vs HOU
Starter · 23.8 minutes
Ivica Zubac scored 4 points, shooting 50% from the field. He added 4 assists and 1 block.
Box-score read
Game impact−4.43
Regular season
Nov 15, 2026 · IND vs PHI
Starter · 22.2 minutes
Ivica Zubac scored 8 points, shooting 50% from the field. He added 5 rebounds and 2 assists.
Box-score read
Game impact−3.61
Regular season
Nov 13, 2026 · IND vs NYK
Starter · 25.8 minutes
Ivica Zubac scored 12 points, shooting 50% from the field. He added 13 rebounds and 1 block.
Box-score read
Game impact+3.97
Regular season
Nov 11, 2026 · IND vs WAS
Starter · 31.4 minutes
Ivica Zubac scored 20 points, shooting 60% from the field. He added 12 rebounds and 2 blocks.
Box-score read
Game impact+2.79
Regular season
Nov 9, 2026 · IND vs DAL
Starter · 27.6 minutes
Ivica Zubac scored 16 points, shooting 71.4% from the field. He shot 75% at the line on 8 attempts. He added 3 rebounds.
Box-score read
Game impact−1.95
Regular season
Nov 7, 2026 · IND vs DEN
Starter · 19.0 minutes
Ivica Zubac scored 10 points, shooting 80% from the field. He added 12 rebounds and 5 assists.
Box-score read
Game impact+1.80
Regular season
Nov 4, 2026 · IND vs MEM
Starter · 18.8 minutes
Ivica Zubac scored 1 points, shooting 0% from the field. He added 4 rebounds and 2 assists.
Box-score read
Game impact−9.00
Regular season
Oct 25, 2026 · IND vs BKN
Starter · 7.0 minutes
Ivica Zubac scored 2 points, shooting 100% from the field. He added 2 assists and 1 rebound.
Box-score read
Game impact−0.53
Regular season
Oct 23, 2026 · IND vs DAL
Starter · 23.6 minutes
Ivica Zubac scored 9 points, shooting 57.1% from the field. He added 11 rebounds and 1 block, with 3 turnovers.
Box-score read
Game impact−3.91
Traded from LAC on 02/05/26
Biography source · ESPN ↗The contract
2026-27 reported base salary
Each salary bar is scaled to the highest reported salary in this contract. Guarantees and trade restrictions are unverified.
HoopsHype · checked 2026-11-01 ↗The morning read
The morning after each game, the Indiana Pacers result comes first: quarter scores, how long each team led and the top players by Game impact. The rest of the night's games follow.
You're in.
The morning read goes to at 8 a.m. Eastern after the next night of games.
Free. One email on mornings after games. Unsubscribe in one click.
Join 673 people who have already signed up.

 Tyrese Haliburton
 Obi Toppin
 Andrew Nembhard
 Braden Smith
 Jarace Walker
 T.J. McConnell