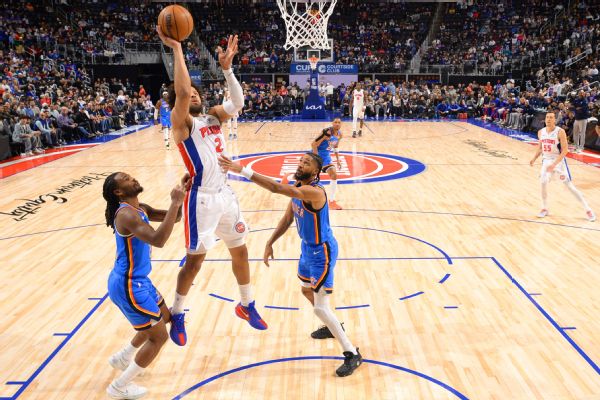
Skip to content
Players Isaiah Joe

Detroit Pistons

IsaiahJoe

#17 · Guard· 6' 4"· 27 years

Inside the game of Isaiah Joe.

Isaiah JoePORTRAIT / NBA GUARD

2026-27 · Regular season

2 games · DET
Points / G10.0
Rebounds / G2.5
Assists / G1.5
Minutes / G18.9
Field goal33.3%
Three-point23.1%

Early returns 2 games are a starting point. These are recorded results, not a projection of player strength.

Recent official source check · 2026-27 regular-season appearances through 2026-10-23. Season totals include published final games.

01 / The film room

The game, in motion.

NBA video library ↗

02 / The scouting file

Look closer.

The role. The questions. The person.

The statistical read

What changes when you look past points per game?

2025-26 · 71 games
1506 recorded minutes

League percentiles: 412 players with at least 20 games, 300 minutes and 100 field-goal attempts in 2025-26. Higher means more of the named statistic. Per-36 rates describe production in the recorded role; they do not project starter minutes.

Scoring volume18.8 PTS / 36
72nd percentile

Points per 36 minutes

Assist production2.2 AST / 36
23rd percentile

Assists per 36 minutes; does not measure every advantage created

Rebound production4.3 REB / 36
23rd percentile

Rebounds per 36 minutes; role and available rebounds matter

Three-point appetite78.8% of FGA
98th percentile

Percentage of field-goal attempts taken from three

Free-throw volume22.7 FTA / 100 FGA
43rd percentile

Free-throw attempts per 100 field-goal attempts

Scoring efficiency65.7% TS
93rd percentile

True shooting percentage, weighted by attempts

How to read this profile

Percentiles compare this season’s qualified NBA players across all positions. Rebounding reflects opportunity as well as skill; assists depend on touches and teammates; shot volume does not measure gravity. True shooting uses aggregate points and attempts, with a 0.44 free-throw multiplier. Per-36 rates use recorded minutes, which may be rounded in historical NBA game logs.

NBA source record ↗
Statistical signal

Three-point appetite

78.8% of attempts from three places Isaiah Joe at the 98th percentile among all qualified players, across positions. The willingness is in the record. Whether defenders stay attached is a separate film question.

Inspect the record ↓
Statistical signal

Scoring efficiency

65.7% true shooting places Isaiah Joe at the 93rd percentile among all qualified players, across positions. The next question is how much of that efficiency survives harder shots or a larger role.

Inspect the record ↓
Film question

How much should you trust the jumper?

42.3% from three on 428 attempts. Separate catch-and-shoot looks from pull-ups, and open attempts from contested ones, before projecting the percentage.

Inspect the record ↓
Film question

Decisions under pressure

2.09 assists per turnover is a starting point. Rewatch possessions against traps and late-clock pressure; this ratio alone cannot tell you how difficult the passing job was.

Inspect the record ↓

Possession detail · 2026-27

Where the shots actually came from.

2 checked games
18 attempts

2 of the last 2 recorded regular-season appearances have event logs that reconcile with the player’s box-score shooting totals. These zones describe that subset.

Paint & short twos
50.0% 2 attempts · 11.1% of shots
Long twos
66.7% 3 attempts · 16.7% of shots
Three-pointers
23.1% 13 attempts · 72.2% of shots

Rim: under 4 feet. Short twos: 4 to under 14 feet. Long twos: 14 feet and farther. NBA event labels determine three-pointers. 83.3% of made field goals carried an assist credit in these logs.

Games in this sample2026-10-23 vs MIA ↗ 2026-10-20 vs BOS ↗

The roster around him

Who else occupies this part of the floor?

Current DET teammates with an overlapping listed position. Their 2025-26 records put the available skill sets side by side; these are individual season numbers, not lineup results.

PlayerPositionMIN / GAST / G3P%3PAREB / G
Cade Cunningham ↗G33.99.934.2%3665.5
Ausar Thompson ↗G-F26.03.125.0%245.7
Kevin Huerter ↗G-F22.52.630.8%3253.5
Elijah Harkless ↗G21.02.923.9%882.0
Daniss Jenkins ↗G20.23.937.4%1952.3

A comparison worth investigating

Similar box-score profiles.

2025-26 · Closest standardized profiles across the six measures above, with equal weight. Numerical resemblance says little about defensive assignments, shot difficulty or career ceiling.

The reporting file

Start with the people who were there.

Read Joe’s official biography and the reporting below for the path to the NBA. A reviewed account of upbringing, scouting disagreements and development is not yet in this file.

Official biography ↗Player reporting ↓

03 / The numbers

A season in motion.

2026-27 regular season · 2 games

Game by game

Per game Rolling 5-game average

Choose a game to see the line. Use the arrow keys to move through the chart.

SampleGPPTSREBASTTS%
Available games210.02.51.547.4%
Last 10210.02.51.547.4%
Last 5210.02.51.547.4%
Off bench210.02.51.547.4%

The shooting profile

Every point has a source.

2026-27 · Percentages and attempt volume.

47.4%True shooting
41.7%Effective FG
60.0%
Two-point5 attempts
23.1%
Three-point13 attempts
71.4%
Free throws7 attempts
Share of points20 total points
Two-pointers 30.0%Three-pointers 45.0%Free throws 25.0%

04 / The reading room

Beyond the stat line.

Player analysis & reporting

Read the Game

Oct 20, 2026 · Regular season

DET vs BOS ↗

Isaiah Joe's eight points required nine field-goal attempts, with Joe shooting 22.2% from the field. A steal and a block provided contributions beyond the difficult shooting night.

Every recorded appearance ↓

05 / The long view

The career, chapter by chapter.

Source record ↗

Points per game · Regular season · Team stints are shown separately where supplied.

SeasonTeamGPMINPTSREBASTSTLBLKFG%3P%FT%
2026-27DET218.910.02.51.50.50.533.3%23.1%71.4%
2025-26OKC7121.211.12.51.30.70.245.5%42.3%89.4%
2024-25OKC7421.710.22.61.60.60.144.0%41.2%82.1%
2023-24OKC7818.58.22.31.30.60.345.8%41.6%86.5%
2022-23OKC7319.19.52.41.20.70.144.1%40.9%82.0%
2021-22PHI5511.13.61.00.60.30.135.0%33.3%93.5%
2020-21PHI419.33.70.90.50.30.136.1%36.8%75.0%

06 / Every appearance

The game log.

2026-27 · 5 recorded games · Download CSV ↓
5 games
CompetitionGameFG%3P%FT%Contribution
Oct 23Regular seasonDET vs MIA ↗18.512310044.4%16.7%75.0%-0.1Box only · provisional
Oct 20Regular seasonDET vs BOS ↗19.38221122.2%28.6%66.7%-3.0Box only · provisional
Oct 14PreseasonDET vs MIN ↗19.714120040.0%20.0%71.4%+1.1Box only · provisional
Oct 10PreseasonDET vs WAS ↗17.15210118.2%0.0%100.0%-10.1Box only · provisional
Oct 5PreseasonDET vs PHX ↗17.87211025.0%16.7%66.7%-4.0Box only · provisional

Shooting percentages use recorded attempts; no attempts is unavailable. Game contribution is not player strength or points caused.

Individual performance breakdowns +

Regular season

Oct 23, 2026 · DET vs MIA

Bench · 18.5 minutes

Impact-0.1
PTS
12
REB
3
AST
1
STL
0
BLK
0
TO
1

Isaiah Joe scored 12 points, shooting 44.4% from the field. He shot 16.7% from three on 6 attempts and 75% at the line. He added 3 rebounds and 1 assist.

Box-score read

Shooting & impact breakdown

Shooting

FG
44.4% 9 attempts
3PT
16.7% 6 attempts
FT
75% 4 attempts
Plus/minus
-8
True shooting
55.8%

How this score adds up

Offensive box value
+7.32
Defensive box value
-0.15
Minutes baseline
-7.26
Game impact
-0.09

Offense credits scoring, assists and offensive rebounds, with deductions for misses and turnovers. Defense uses defensive rebounds, steals, blocks and fouls. The baseline adjusts for minutes at this game's average box value. Tracking and hustle inputs are unavailable.

Box only · provisional · Calculated Oct 24, 2026 · 13:10 UTC. Game contribution is not player strength or points caused.

Regular season

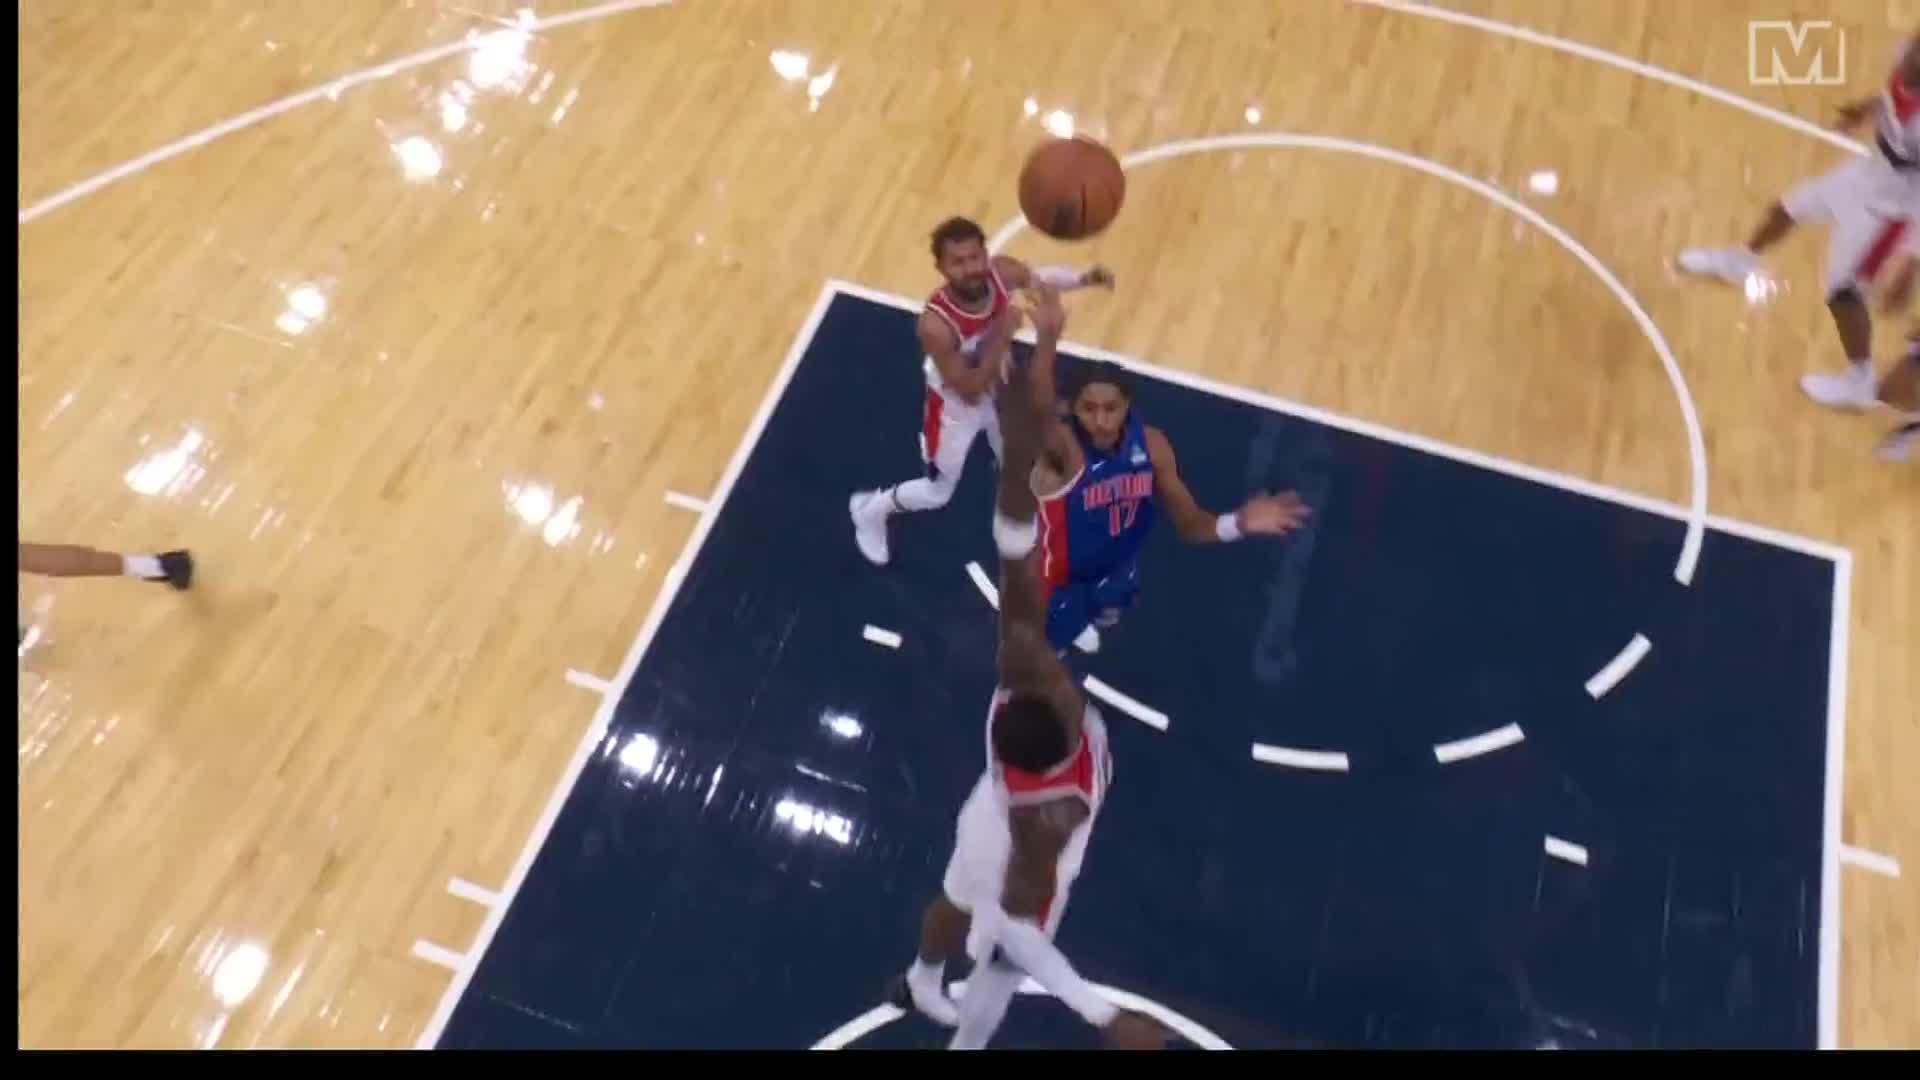
Oct 20, 2026 · DET vs BOS

Bench · 19.3 minutes

Impact-3.0
PTS
8
REB
2
AST
2
STL
1
BLK
1
TO
1

Isaiah Joe's eight points required nine field-goal attempts, with Joe shooting 22.2% from the field. A steal and a block provided contributions beyond the difficult shooting night.

Player analysis

Shooting & impact breakdown

Shooting

FG
22.2% 9 attempts
3PT
28.6% 7 attempts
FT
66.7% 3 attempts
Plus/minus
+0
True shooting
38.8%

How this score adds up

Offensive box value
+0.77
Defensive box value
+3.80
Minutes baseline
-7.57
Game impact
-3.00

Offense credits scoring, assists and offensive rebounds, with deductions for misses and turnovers. Defense uses defensive rebounds, steals, blocks and fouls. The baseline adjusts for minutes at this game's average box value. Tracking and hustle inputs are unavailable.

Box only · provisional · Calculated Oct 24, 2026 · 13:10 UTC. Game contribution is not player strength or points caused.
Preseason

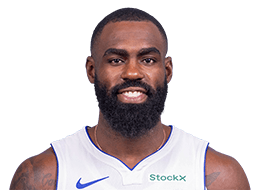
Oct 14, 2026 · DET vs MIN

Bench · 19.7 minutes

Impact+1.1
PTS
14
REB
1
AST
2
STL
0
BLK
0
TO
0

A player write-up is not available for these statistics yet.

Shooting & impact breakdown

Shooting

FG
40% 10 attempts
3PT
20% 5 attempts
FT
71.4% 7 attempts
Plus/minus
+12
True shooting
53.5%

How this score adds up

A matching component breakdown is not published for this rating. Missing components are not zero.

Box only · provisional · Calculated Oct 15, 2026 · 04:15 UTC. Game contribution is not player strength or points caused.

Preseason

Oct 10, 2026 · DET vs WAS

Bench · 17.1 minutes

Impact-10.1
PTS
5
REB
2
AST
1
STL
0
BLK
1
TO
3

A player write-up is not available for these statistics yet.

Shooting & impact breakdown

Shooting

FG
18.2% 11 attempts
3PT
0% 7 attempts
FT
100% 1 attempts
Plus/minus
-6
True shooting
21.9%

How this score adds up

A matching component breakdown is not published for this rating. Missing components are not zero.

Box only · provisional · Calculated Oct 13, 2026 · 09:52 UTC. Game contribution is not player strength or points caused.

Preseason

Oct 5, 2026 · DET vs PHX

Bench · 17.8 minutes

Impact-4.0
PTS
7
REB
2
AST
1
STL
1
BLK
0
TO
1

A player write-up is not available for these statistics yet.

Shooting & impact breakdown

Shooting

FG
25% 8 attempts
3PT
16.7% 6 attempts
FT
66.7% 3 attempts
Plus/minus
-3
True shooting
37.6%

How this score adds up

A matching component breakdown is not published for this rating. Missing components are not zero.

Box only · provisional · Calculated Oct 13, 2026 · 09:32 UTC. Game contribution is not player strength or points caused.

07 / The player file

How Joe got here.

At a glance.

Height
6' 4"
Weight
165 lbs
Age now
27 years
Born
1999-07-02
Hometown
Fort Smith, AR
College
Arkansas
Draft
2020: Rd 2, Pk 49 (PHI)
Experience
7th Season

Traded from OKC on 07/06/26

Biography source · ESPN ↗

The contract

$11.32M

2026-27 reported base salary

2026-27
$11.32M
2027-28
$11.32MTeam option

Reported base salary. Guarantees and trade restrictions are unverified.

HoopsHype · checked 2026-10-20 ↗

Keep exploring

The players around him.

Detroit Pistons ↗

The record behind the page

Official roster ↗ · checked 2026-10-24. Career, biography and publisher links checked 2026-10-25. Our methodology ↗

Historical teams belong to their seasons. Missing statistics stay unavailable. Articles and videos belong to their respective publishers.