How much should you trust the jumper?
25.0% from three on 8 attempts. Fewer than 100 attempts leave plenty of room for the percentage to move. Watch the misses and the closeouts, too.
Inspect the record ↓#30 · Guard· 6' 6"· 28 years
Inside the game of Alex Morales.
 PORTRAIT / NBA GUARD
2026-27 · Regular season
8 games · ORLEarly returns 8 games are a starting point. These are recorded results, not a projection of player strength.
The morning read
Every Orlando Magic game in your inbox the next morning at 8 a.m. Eastern, with quarter scores, how long each team led and the top players by Game impact.
You're in.
The morning read goes to at 8 a.m. Eastern after the next night of games.
Free. Unsubscribe in one click. Join 671 people who have already signed up.
Read the Game / 2026-27 regular season
90% sampling interval -4.3 to -2.7
8 recorded games · 85 minutes with reconciled lineups.
Separate offense and defense estimates, adjusted for lineup context.
Positive helps on either end. Spacing uses shooting threat, not direct gravity. Defensive estimates do not isolate every assignment or off-ball action.
Above or below a minutes-weighted league average. This estimates player strength in the observed role; it is not points caused or a guarantee over starter minutes. Short samples borrow more from prior seasons and the league. Intervals measure sampling variation conditional on the recorded features.
Games through 2026-11-16 · 7 of 10 tracking families observed · opportunity-adjusted-impact-v3 · Data & source coverage ↗
The scouting lab / 20 skills. Every angle.
Find the shape of Morales’s game. Explore every skill, put the numbers in league context, then place another player alongside him.

2026-27 / Regular season
8 games · 12.5 MPG · 100.3 minutes
All axes run from 0 to 100. The halfway ring marks the 50th percentile.
Read the detail
Choose a skill to inspect its value, league baseline and sample. Use the category filters to focus the view.
Statistical neighbors
Compare the whole skill profile.
Closest profiles by equal-weight distance across all 20 skill percentiles. This describes statistical similarity, not the same role, style or ceiling. Lower distance means a closer profile.
ESPN’s Net Points model assigns offensive and defensive credit from game events. These are attributed ESPN estimates, separate from RTG’s Game impact. Adding the two would count shared evidence twice.
Percentiles compare published players in the same season who meet your minutes threshold. Ties receive their midpoint rank. We require at least 20 available values per skill; missing values stay unavailable. The league mean is the arithmetic average of player rates, not the 50th percentile. “League impact spread” sorts by the highest minus lowest rate in that pool. “Player strengths” sorts by percentile, or by rate above the league mean in the Net Points view.
Only source samples reconciled to official NBA identities, games and minutes enter this view. The league pool excludes withheld or unavailable profiles. A subject below your minutes threshold is still shown against the qualifying pool and explicitly marked. A previous-season comparison uses that season’s own pool at the same minutes threshold.
These event-based estimates do not fully measure spacing, off-ball deterrence, screen navigation or defensive assignments. Turnover cost is affected by offensive responsibility. Defensive field-goal credit is a model estimate, not a shooting percentage. A short-sample rank is not an ability forecast.
195.7 ESPN possessions · sample through 2026-11-11 · source checked 2026-11-17 17:17 UTC.
01 / The film room
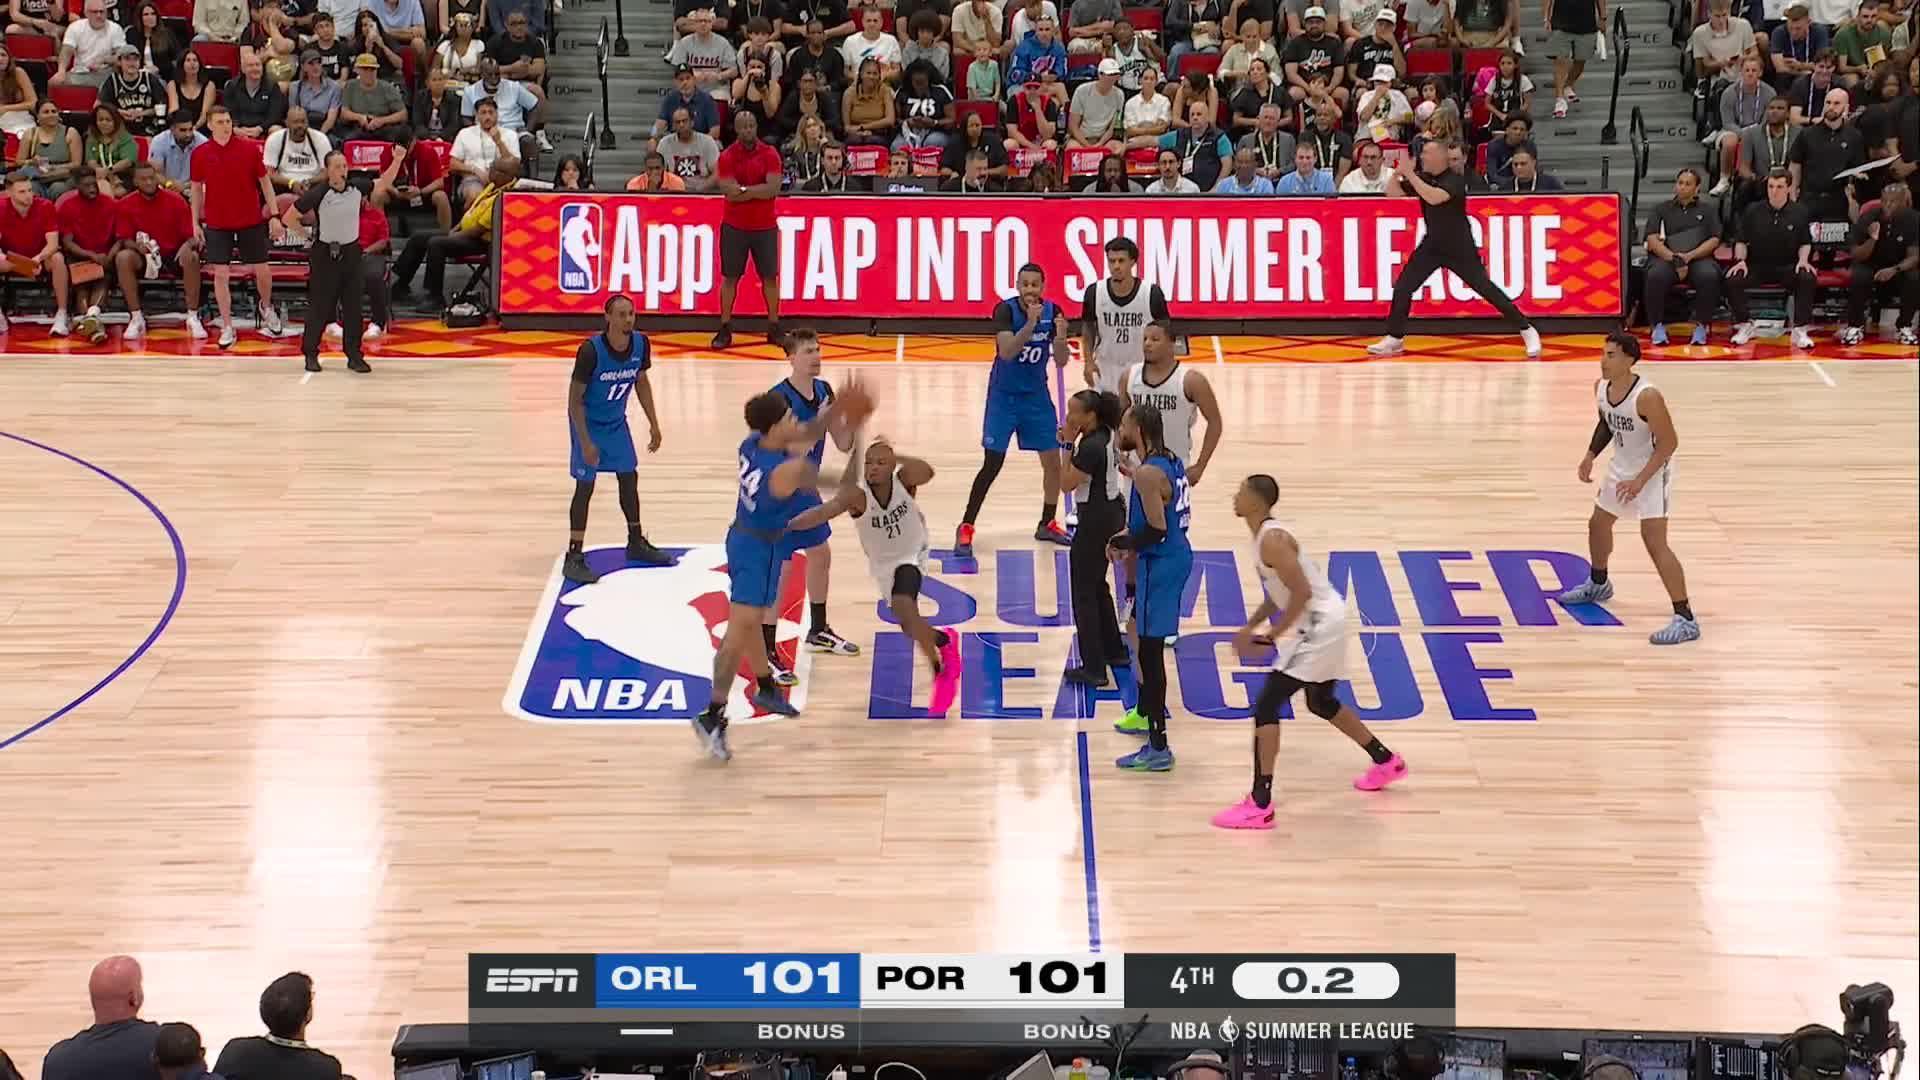 Game highlights / ESPN
Watch on ESPN
1:09
ESPN · 2026-07-13
Open the full clip with the publisher.
02 / The scouting file
The role. The questions. The person.
The statistical read
Not ranked: a ranking needs 100 minutes and 30 field-goal attempts, and this sample has 100 minutes and 15 attempts. Per-36 rates describe production in the recorded role; they do not project starter minutes.
Points per 36 minutes
Assists per 36 minutes; does not measure every advantage created
Rebounds per 36 minutes; role and available rebounds matter
Percentage of field-goal attempts taken from three
Free-throw attempts per 100 field-goal attempts
True shooting percentage, weighted by attempts
Percentiles rank this sample against the season’s qualified NBA players across all positions: at least 20 games, 300 minutes and 100 field-goal attempts. Until enough players reach that in the current season, the previous season’s qualified players are used, and the note above names the season. A player needs 100 minutes and 30 field-goal attempts in the sample to be ranked. Rebounding reflects opportunity as well as skill; assists depend on touches and teammates; shot volume does not measure gravity. True shooting uses aggregate points and attempts, with a 0.44 free-throw multiplier. Per-36 rates use recorded minutes, which may be rounded in historical NBA game logs.
NBA source record ↗25.0% from three on 8 attempts. Fewer than 100 attempts leave plenty of room for the percentage to move. Watch the misses and the closeouts, too.
Inspect the record ↓1.67 assists per turnover is a starting point. Rewatch possessions against traps and late-clock pressure; this ratio alone cannot tell you how difficult the passing job was.
Inspect the record ↓Possession detail · 2026-27
5 of the last 8 recorded regular-season appearances have event logs that reconcile with the player’s box-score shooting totals. These zones describe that subset.
Rim: under 4 feet. Short twos: 4 to under 14 feet. Long twos: 14 feet and farther. NBA event labels determine three-pointers. 71.4% of made field goals carried an assist credit in these logs.
The roster around him
Current ORL teammates with an overlapping listed position. Their 2026-27 records put the available skill sets side by side; these are individual season numbers, not lineup results.
| Player | Position | MIN / G | AST / G | 3P% | 3PA | REB / G |
|---|---|---|---|---|---|---|
| Desmond Bane ↗ | G | 35.0 | 2.7 | 40.7% | 118 | 4.4 |
| Anthony Black ↗ | G | 32.2 | 5.6 | 40.4% | 52 | 5.2 |
| Jalen Suggs ↗ | G | 29.1 | 4.8 | 21.1% | 19 | 4.6 |
| Jase Richardson ↗ | G | 21.8 | 2.5 | 22.2% | 36 | 1.9 |
| Jevon Carter ↗ | G | 14.6 | 1.7 | 29.7% | 37 | 1.1 |
The reporting file
Read Morales’s official biography and the reporting below for the path to the NBA. A reviewed account of upbringing, scouting disagreements and development is not yet in this file.
Official biography ↗Player reporting ↓03 / The numbers
2026-27 regular season · 8 games
Choose a game to see the line. Use the arrow keys to move through the chart.
| Sample | GP | PTS | REB | AST | TS% |
|---|---|---|---|---|---|
| Available games | 8 | 2.1 | 2.4 | 0.6 | 53.5% |
| Last 10 | 8 | 2.1 | 2.4 | 0.6 | 53.5% |
| Last 5 | 5 | 3.0 | 3.0 | 0.8 | 58.2% |
| Starts | 1 | 5.0 | 4.0 | 3.0 | 62.5% |
| Off bench | 7 | 1.7 | 2.1 | 0.3 | 50.5% |
The shooting profile
2026-27 · Percentages and attempt volume.
04 / The reading room
Read the Game
Reviewed player analysis appears here as game reports are published.
Open the latest game ↗Every recorded appearance ↓

2026-27 / NBA tracking
Season totals · checked 2026-11-17
The NBA’s tracking feeds reveal different parts of the job. Each panel shows its own sample and source date; coverage can lag the latest game. The full impact section above explains which evidence enters RTG’s model.
hustle
8 tracked games · 8 official appearances
rebounding
7 tracked games · 8 official appearances
drives
8 tracked games · 8 official appearances
touches
8 tracked games · 8 official appearances
passing
8 tracked games · 8 official appearances
Optical tracking
Provider scores have different units. They are not percentiles, causal effects or RTG impact ratings.
Shot quality
The NBA leader feed does not include a qualifying shot-quality sample for this player. It is unavailable, not zero.
Defense
7 tracked games · 22 defended attempts
Closest-defender shooting describes this sample. Shot difficulty, help and assignments affect it; it is not an isolated measure of defensive ability.
NBA defense · 2026-11-17 ↗Defensive assignments
185 tracked partial possessions through 2026-11-16. Scoring rates use this season and half of last season. The difference compares his own assignments with everyone he shared the floor with, so it does not rise just because he plays against starters.
This describes the job he is given, not how well he does it. It is not part of Game impact or Full impact: when we tested it on two seasons, crediting it did not make predictions better. How it is measured · League ranking
Defensive assignments
Eight largest recorded matchup samples at most. Partial possessions are tracking assignments, not completed possessions for RAPM. Opponent shooting is affected by help, shot mix and sample size.
| Opponent | Minutes | Partial possessions | Opponent FG% | Attempts |
|---|---|---|---|---|
| Darryn Peterson | 3.0 | 16.8 | 66.7% | 3 |
| Darius Acuff Jr. | 3.1 | 14.8 | 100.0% | 2 |
| Keyonte George | 2.1 | 12.3 | 33.3% | 3 |
| Yaxel Lendeborg | 2.2 | 10.6 | — | 0 |
| Zach LaVine | 1.9 | 6.9 | 100.0% | 1 |
| Kyshawn George | 1.1 | 6.5 | 100.0% | 1 |
| Keegan Murray | 1.1 | 5.7 | 50.0% | 2 |
| Emanuel Sharp | 0.8 | 5.3 | 0.0% | 1 |
05 / The long view
Points per game · Regular season · Team stints are shown separately where supplied.
| Season | Team | GP | MIN | PTS | REB | AST | STL | BLK | FG% | 3P% | FT% |
|---|---|---|---|---|---|---|---|---|---|---|---|
| 2026-27 | ORL | 8 | 12.5 | 2.1 | 2.4 | 0.6 | 0.4 | 0.0 | 46.7% | 25.0% | 50.0% |
| 2025-26 | ORL | 4 | 6.0 | 2.0 | 0.8 | 1.0 | 0.0 | 0.0 | 42.9% | 0.0% | 100.0% |
06 / Every appearance
| Competition | Game | FG% | 3P% | FT% | Game impact | |||||||
|---|---|---|---|---|---|---|---|---|---|---|---|---|
| Nov 11 | Regular season | ORL vs UTA ↗ | 17.5 | 5 | 4 | 3 | 0 | 0 | 50.0% | 33.3% | — | -1.8 |
| Nov 10 | Regular season | ORL vs SAC ↗ | 28.9 | 7 | 7 | 0 | 0 | 0 | 50.0% | 33.3% | — | +3.1 |
| Nov 7 | Regular season | ORL vs GSW ↗ | 14.9 | 0 | 2 | 1 | 0 | 0 | — | — | — | — |
| Nov 5 | Regular season | ORL vs PHX ↗ | 6.0 | 0 | 0 | 0 | 1 | 0 | — | — | — | +1.2 |
| Nov 2 | Regular season | ORL vs WAS ↗ | 13.5 | 3 | 2 | 0 | 2 | 0 | 50.0% | 0.0% | 50.0% | +2.1 |
| Oct 30 | Regular season | ORL vs TOR ↗ | 8.8 | 0 | 1 | 0 | 0 | 0 | — | — | — | -0.9 |
| Oct 28 | Regular season | ORL vs TOR ↗ | 7.1 | 2 | 2 | 1 | 0 | 0 | 50.0% | 0.0% | — | -2.0 |
| Oct 23 | Regular season | ORL vs MIN ↗ | 3.5 | 0 | 1 | 0 | 0 | 0 | 0.0% | — | — | -1.2 |
| Oct 16 | Preseason | ORL vs MIA ↗ | 16.6 | 1 | 4 | 2 | 0 | 0 | 0.0% | 0.0% | 50.0% | — |
| Oct 13 | Preseason | ORL vs CLE ↗ | 7.5 | 2 | 3 | 0 | 0 | 0 | 0.0% | 0.0% | 100.0% | — |
| Oct 11 | Preseason | ORL vs CLE ↗ | 15.5 | 0 | 0 | 1 | 1 | 0 | 0.0% | 0.0% | — | — |
| Oct 7 | Preseason | ORL vs MEM ↗ | 24.4 | 4 | 10 | 2 | 1 | 1 | 40.0% | 0.0% | 0.0% | — |
No games match these filters.
Shooting percentages use recorded attempts; no attempts is unavailable. Game impact is in points of margin for one game; a dash means it is not published for that game. It is not a rating of player strength.
What the NBA’s cameras and scorers recorded in each game, beyond the box score. 8 games tracked this season. A boxed number is the season high.
| Date | Game | TCH | 2AST | CONT | DEFL | LOOSE | BOX | SCR | RIM D |
|---|---|---|---|---|---|---|---|---|---|
| Nov 11 | ORL vs UTA | 17 | 0 | 2 | 1 | 0 | 0 | 1 | 0 of 0 |
| Nov 10 | ORL vs SAC | 26 | 0 | 4 | 1 | 0 | 0 | 4 | 0 of 0 |
| Nov 7 | ORL vs GSW | 10 | 0 | 1 | 1 | 0 | 0 | 1 | 0 of 0 |
| Nov 5 | ORL vs PHX | 2 | 0 | 0 | 0 | 0 | 0 | 0 | 0 of 0 |
| Nov 2 | ORL vs WAS | 21 | 1 | 1 | 2 | 0 | 1 | 0 | 1 of 1 |
| Oct 30 | ORL vs TOR | 7 | 0 | 1 | 0 | 1 | 0 | 0 | 0 of 0 |
| Oct 28 | ORL vs TOR | 17 | 1 | 1 | 1 | 0 | 1 | 0 | 0 of 0 |
| Oct 23 | ORL vs MIN | 7 | 0 | 0 | 1 | 0 | 0 | 0 | 0 of 0 |
Source: NBA tracking, hustle and matchup box scores, checked after each final and again once corrections settle. A dash means the league did not publish that count for the game. These counts describe a game. They are not part of Game impact or Full impact.
Regular season
Nov 11, 2026 · ORL vs UTA
Starter · 17.5 minutes
Alex Morales scored 5 points, shooting 50% from the field. He shot 33.3% from three on 3 attempts. He added 3 assists and 4 rebounds.
Box-score read
Game impact−1.78
Regular season
Nov 10, 2026 · ORL vs SAC
Bench · 28.9 minutes
Alex Morales scored 7 points, shooting 50% from the field. He shot 33.3% from three on 3 attempts. He added 7 rebounds.
Box-score read
Game impact+3.11
Regular season
Nov 7, 2026 · ORL vs GSW
Bench · 14.9 minutes
Alex Morales scored 0 points. He added 2 rebounds and 1 assist.
Box-score read
Game impact is not available for this game. The official substitution record does not reconcile with the box score, so the lineups on the floor cannot be confirmed.
Regular season
Nov 5, 2026 · ORL vs PHX
Bench · 6.0 minutes
Alex Morales scored 0 points. He added 1 steal.
Box-score read
Game impact+1.17
Regular season
Nov 2, 2026 · ORL vs WAS
Bench · 13.5 minutes
Alex Morales scored 3 points, shooting 50% from the field. He added 2 steals and 2 rebounds.
Box-score read
Game impact+2.14
Regular season
Oct 30, 2026 · ORL vs TOR
Bench · 8.8 minutes
Alex Morales scored 0 points. He added 1 rebound.
Box-score read
Game impact−0.94
Regular season
Oct 28, 2026 · ORL vs TOR
Bench · 7.1 minutes
Alex Morales scored 2 points, shooting 50% from the field. He added 2 rebounds and 1 assist.
Box-score read
Game impact−1.95
Regular season
Oct 23, 2026 · ORL vs MIN
Bench · 3.5 minutes
Alex Morales scored 0 points, shooting 0% from the field. He added 1 rebound.
Box-score read
Game impact−1.22
Preseason
Oct 16, 2026 · ORL vs MIA
Bench · 16.6 minutes
Alex Morales scored 1 points, shooting 0% from the field. He added 4 rebounds and 2 assists.
Box-score read
Game impact is calculated for regular-season games only.
Preseason
Oct 13, 2026 · ORL vs CLE
Bench · 7.5 minutes
Alex Morales scored 2 points, shooting 0% from the field. He added 3 rebounds.
Box-score read
Game impact is calculated for regular-season games only.
07 / The player file
Signed on 10/08/22
Biography source · ESPN ↗The contract
2026-27 reported base salary
Reported base salary. Guarantees and trade restrictions are unverified.
HoopsHype · checked 2026-11-01 ↗Keep exploring
The morning read
The morning after each game, the Orlando Magic result comes first: quarter scores, how long each team led and the top players by Game impact. The rest of the night's games follow.
You're in.
The morning read goes to at 8 a.m. Eastern after the next night of games.
Free. One email on mornings after games. Unsubscribe in one click.
Join 671 people who have already signed up.

 Anthony Black
 Jonathan Isaac
 Jevon Carter
 Desmond Bane
 Jalen Suggs
 Paolo Banchero