+1.3Estimated points of margin per 48 minutes · 0 is league average
90% sampling interval +0.9 to +1.6
2 recorded games · 3 minutes with reconciled lineups.
Separate offense and defense estimates, adjusted for lineup context.
Offense / 48+0.4
Defense / 48+0.9
Positive offense means more points scored than average. Positive defense means more points prevented. Spacing uses shooting threat, not direct gravity. Defensive estimates do not isolate every assignment or off-ball action.
How Full impact is estimated
Zero is the minutes-weighted league average. This estimates player strength in the observed role; it is not points caused or a guarantee over starter minutes. Short samples borrow more from prior seasons and the league. Intervals measure sampling variation conditional on the recorded features.
Games through 2026-11-21 · 7 of 10 tracking families observed · opportunity-adjusted-impact-v3 · Data & source coverage ↗
Compare the credit ESPN assigns Lovering for scoring, creating shots, rebounding and defense per 100 possessions.
2026-27 / Regular season
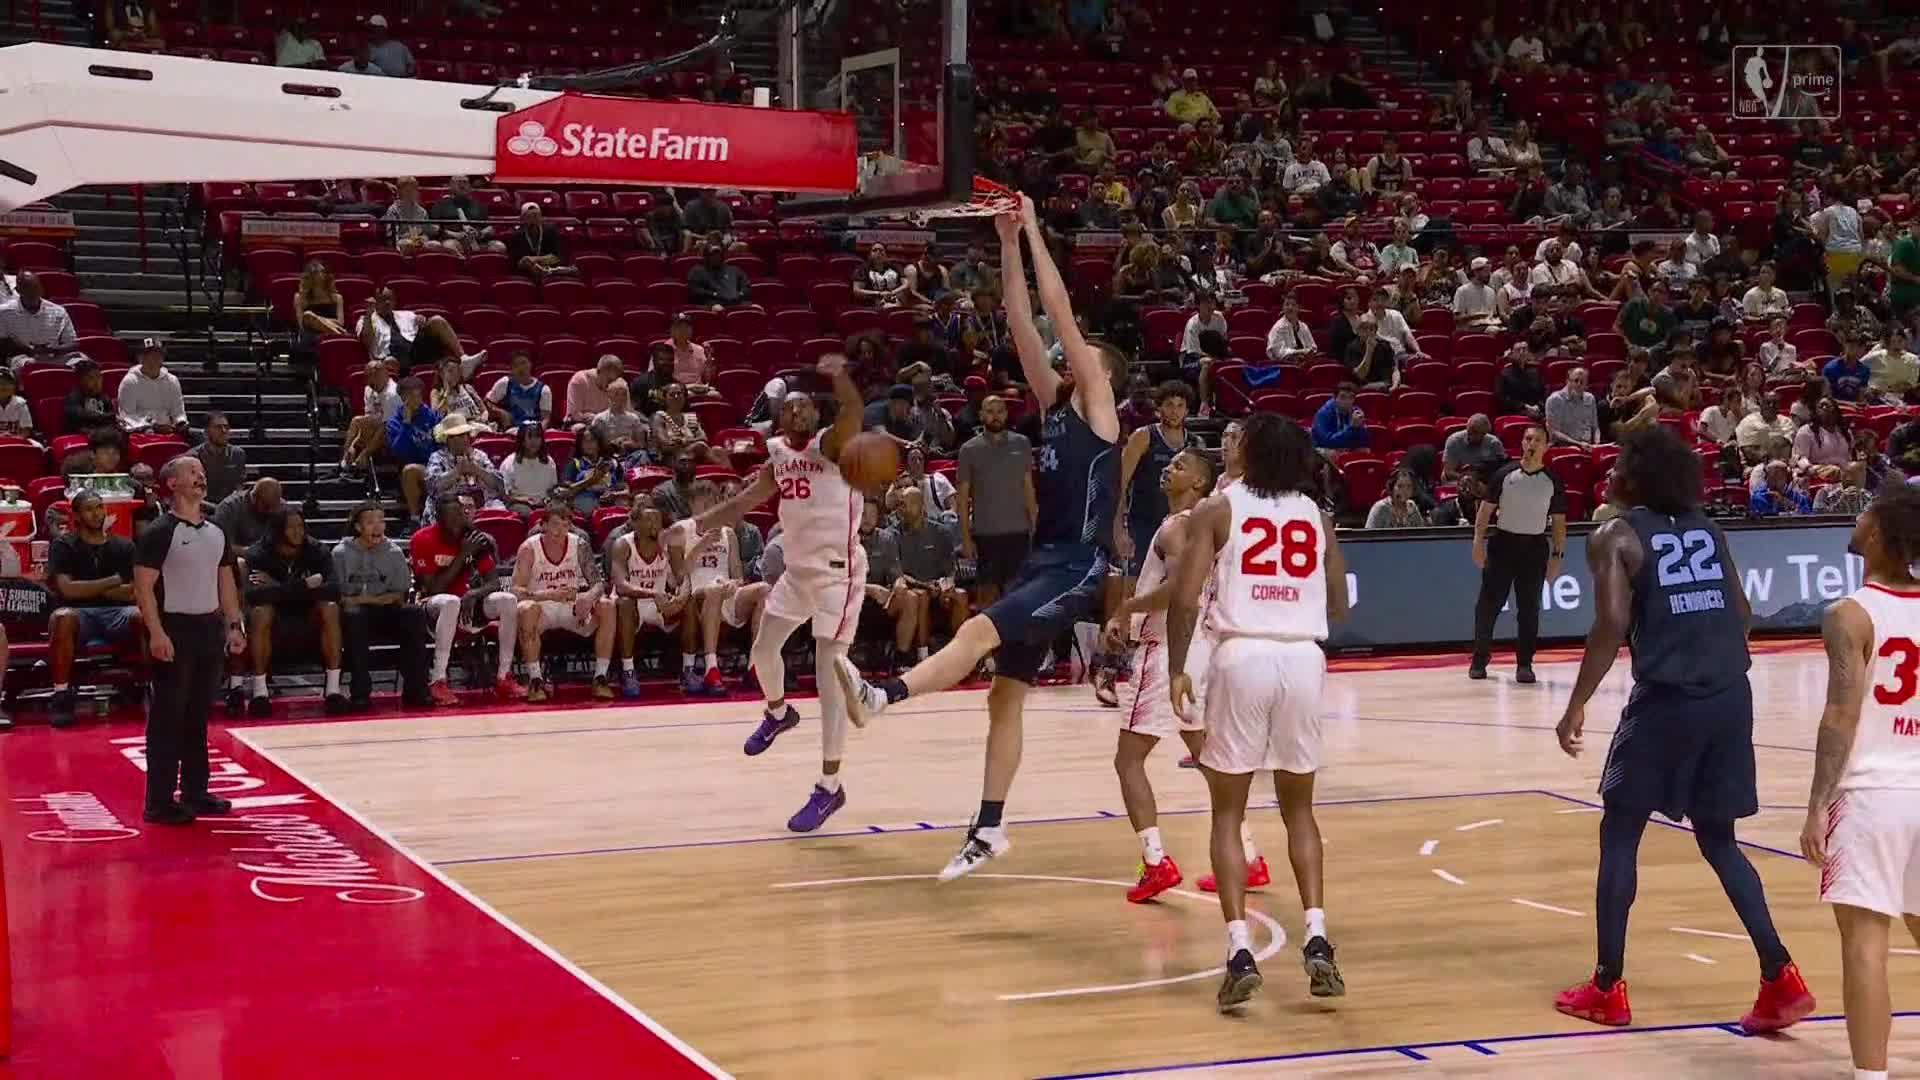
Lawson Lovering
2 games · 1.3 MPG · 2.5 minutes
Overall-5.305 / 100 among peers
Offense-4.028 / 100 among peers
Defense-1.2816 / 100 among peers
ESPN Net Points / 100 possessions · positive earns credit on either end
Early returns: 2 games. A description of this stretch, not a settled estimate of ability. Below the 100-minute comparison threshold; his rank is measured against the qualifying pool.
304 verified players · 2026-27 · minimum 100 minutesHigher percentile = more credit in this measure
Skill percentiles League comparison
Lawson LoveringLeague mean
All axes run from 0 to 100. The halfway ring marks the 50th percentile.
Select a skill to see its Net Points and league average.
All skillsNet Pts / 100 · percentile
Skill categories overlap. These 20 values cannot be added into an overall rating.
Players with similar skill rankings
Closest profiles by equal-weight distance across all 20 skill percentiles. This describes statistical similarity, not the same role, style or ceiling. Lower distance means a closer profile.
How ESPN calculates Net Points Sources and samples
ESPN’s Net Points model assigns offensive and defensive credit from game events. These are attributed ESPN estimates, separate from RTG’s Game impact. Adding the two would count shared evidence twice.
Percentiles compare published players in the same season who meet your minutes threshold. Ties receive their midpoint rank. We require at least 20 available values per skill; missing values stay unavailable. The league mean is the arithmetic average of player rates, not the 50th percentile. “League impact spread” sorts by the highest minus lowest rate in that pool. “Player strengths” sorts by percentile, or by rate above the league mean in the Net Points view.
Only source samples reconciled to official NBA identities, games and minutes enter this view. The league pool excludes withheld or unavailable profiles. A subject below your minutes threshold is still shown against the qualifying pool and explicitly marked. A previous-season comparison uses that season’s own pool at the same minutes threshold.
These event-based estimates do not fully measure spacing, off-ball deterrence, screen navigation or defensive assignments. Turnover cost is affected by offensive responsibility. Defensive field-goal credit is a model estimate, not a shooting percentage. A short-sample rank is not an ability forecast.
5.4 ESPN possessions · sample through 2026-11-04 · source checked 2026-11-22 14:14 UTC.
2025-26 · 2 games · 50 recorded minutes.
Not ranked: a ranking needs 100 minutes and 30 field-goal attempts, and this sample has 50 minutes and 10 attempts.
Scoring volume10.1 PTS / 36Not ranked
Points per 36 minutes
Assist production2.2 AST / 36Not ranked
Assists per 36 minutes; does not measure every advantage created
Rebound production10.8 REB / 36Not ranked
Rebounds per 36 minutes; role and available rebounds matter
Share of shots from three0.0% of FGANot ranked
Percentage of field-goal attempts taken from three
Free-throw volume50.0 FTA / 100 FGANot ranked
Free-throw attempts per 100 field-goal attempts
Scoring efficiency57.4% TSNot ranked
True shooting percentage, weighted by attempts
Comparison group and source
Players in the comparison group played at least 20 games and 300 minutes and took 100 shots from the field. Lovering needs 100 minutes and 30 shots to receive a percentile.
When he defended the shot Opponents shot 0.0% with Lovering closest, compared with their usual 49.8%. 1 tracked attempts. Help defense and shot mix matter.
All tracking comparisons and sources
Typical is the median for centers in the same season.
Screening and defense
A screen assist is a pick that leads directly to a teammate’s basket.
The NBA has no qualifying shot-quality sample for Lovering.
Each comparison uses the same season and NBA feed. Count rates require five games and 100 tracked minutes. Drive turnovers also require 20 drives. Shooting comparisons need 25 attempts and NBA gravity and leverage scores need five games. Each group needs at least 20 eligible players. Ties share their place.
Who Lovering guards most often
Eight largest recorded matchup samples at most. Partial possessions are tracking assignments, not completed possessions for RAPM. Opponent shooting is affected by help, shot mix and sample size.
Opponent shooting percentage at the rim with this player defending
Source: NBA tracking, hustle and matchup box scores, checked after each final and again once corrections settle. A dash means the league did not publish that count for the game. These counts describe a game. They are not part of Game impact or Full impact.
Last 2 performance breakdowns +
Regular season
Nov 4, 2026 · LAL vs SAC
Bench · 1.2 minutes
Game impact+0.2
PTS
0
REB
0
AST
0
STL
0
BLK
1
TO
0
Lawson Lovering scored 0 points. He added 1 block.