Assist production
5.2 AST / 36 places Devin Carter at the 78th percentile among all qualified players, across positions. Assists make passing worth studying. They do not capture missed reads or possessions without the ball.
Inspect the record ↓#22 · Guard· 6' 2"· 24 years
Inside the game of Devin Carter.
 PORTRAIT / NBA GUARD
Last completed season · 2025-26
38 games · SAC2026-27 No verified regular-season sample yet. The numbers above describe 2025-26; preseason is separate below.
NBA game-log minutes are rounded; season averages may differ slightly from the league’s full-precision totals.
01 / The film room
02 / The scouting file
The role. The questions. The person.
The statistical read
League percentiles: 412 players with at least 20 games, 300 minutes and 100 field-goal attempts in 2025-26. Higher means more of the named statistic. Per-36 rates describe production in the recorded role; they do not project starter minutes.
Points per 36 minutes
Assists per 36 minutes; does not measure every advantage created
Rebounds per 36 minutes; role and available rebounds matter
Percentage of field-goal attempts taken from three
Free-throw attempts per 100 field-goal attempts
True shooting percentage, weighted by attempts
Percentiles compare this season’s qualified NBA players across all positions. Rebounding reflects opportunity as well as skill; assists depend on touches and teammates; shot volume does not measure gravity. True shooting uses aggregate points and attempts, with a 0.44 free-throw multiplier. Per-36 rates use recorded minutes, which may be rounded in historical NBA game logs.
NBA source record ↗5.2 AST / 36 places Devin Carter at the 78th percentile among all qualified players, across positions. Assists make passing worth studying. They do not capture missed reads or possessions without the ball.
Inspect the record ↓32.2 FTA / 100 FGA places Devin Carter at the 74th percentile among all qualified players, across positions. Look for how the trips are earned: drives, post work, putbacks or intentional fouls.
Inspect the record ↓26.3% from three on 114 attempts. Separate catch-and-shoot looks from pull-ups, and open attempts from contested ones, before projecting the percentage.
Inspect the record ↓1.87 assists per turnover is a starting point. Rewatch possessions against traps and late-clock pressure; this ratio alone cannot tell you how difficult the passing job was.
Inspect the record ↓The roster around him
Current BOS teammates with an overlapping listed position. Their 2025-26 records put the available skill sets side by side; these are individual season numbers, not lineup results.
| Player | Position | MIN / G | AST / G | 3P% | 3PA | REB / G |
|---|---|---|---|---|---|---|
| Derrick White ↗ | G | 34.1 | 5.4 | 32.7% | 640 | 4.4 |
| Jayson Tatum ↗ | F-G | 32.6 | 5.3 | 32.9% | 143 | 10.0 |
| Payton Pritchard ↗ | G | 32.4 | 5.2 | 37.7% | 562 | 3.9 |
| Baylor Scheierman ↗ | G | 18.6 | 1.5 | 39.9% | 243 | 3.5 |
| Mike Conley ↗ | G | 18.4 | 2.9 | 33.7% | 166 | 1.7 |
A comparison worth investigating
2025-26 · Closest standardized profiles across the six measures above, with equal weight. Numerical resemblance says little about defensive assignments, shot difficulty or career ceiling.


The reporting file
Read Carter’s official biography and the reporting below for the path to the NBA. A reviewed account of upbringing, scouting disagreements and development is not yet in this file.
Official biography ↗Player reporting ↓03 / The numbers
2025-26 regular season · 38 games
The shooting profile
2025-26 · Percentages and attempt volume.
04 / The reading room
Read the Game
Reviewed player analysis appears here as game reports are published.
Open the latest game ↗Every recorded appearance ↓ESPN ·
André Snellings and Eric Moody

05 / The long view
Points per game · Regular season · Team stints are shown separately where supplied.
| Season | Team | GP | MIN | PTS | REB | AST | STL | BLK | FG% | 3P% | FT% |
|---|---|---|---|---|---|---|---|---|---|---|---|
| 2025-26 | SAC | 38 | 18.4 | 8.9 | 3.3 | 2.7 | 0.9 | 0.2 | 41.4% | 26.3% | 71.3% |
| 2024-25 | SAC | 36 | 11.0 | 3.8 | 2.1 | 1.1 | 0.6 | 0.1 | 37.0% | 29.5% | 59.1% |
06 / Every appearance
| Competition | Game | FG% | 3P% | FT% | Contribution | |||||||
|---|---|---|---|---|---|---|---|---|---|---|---|---|
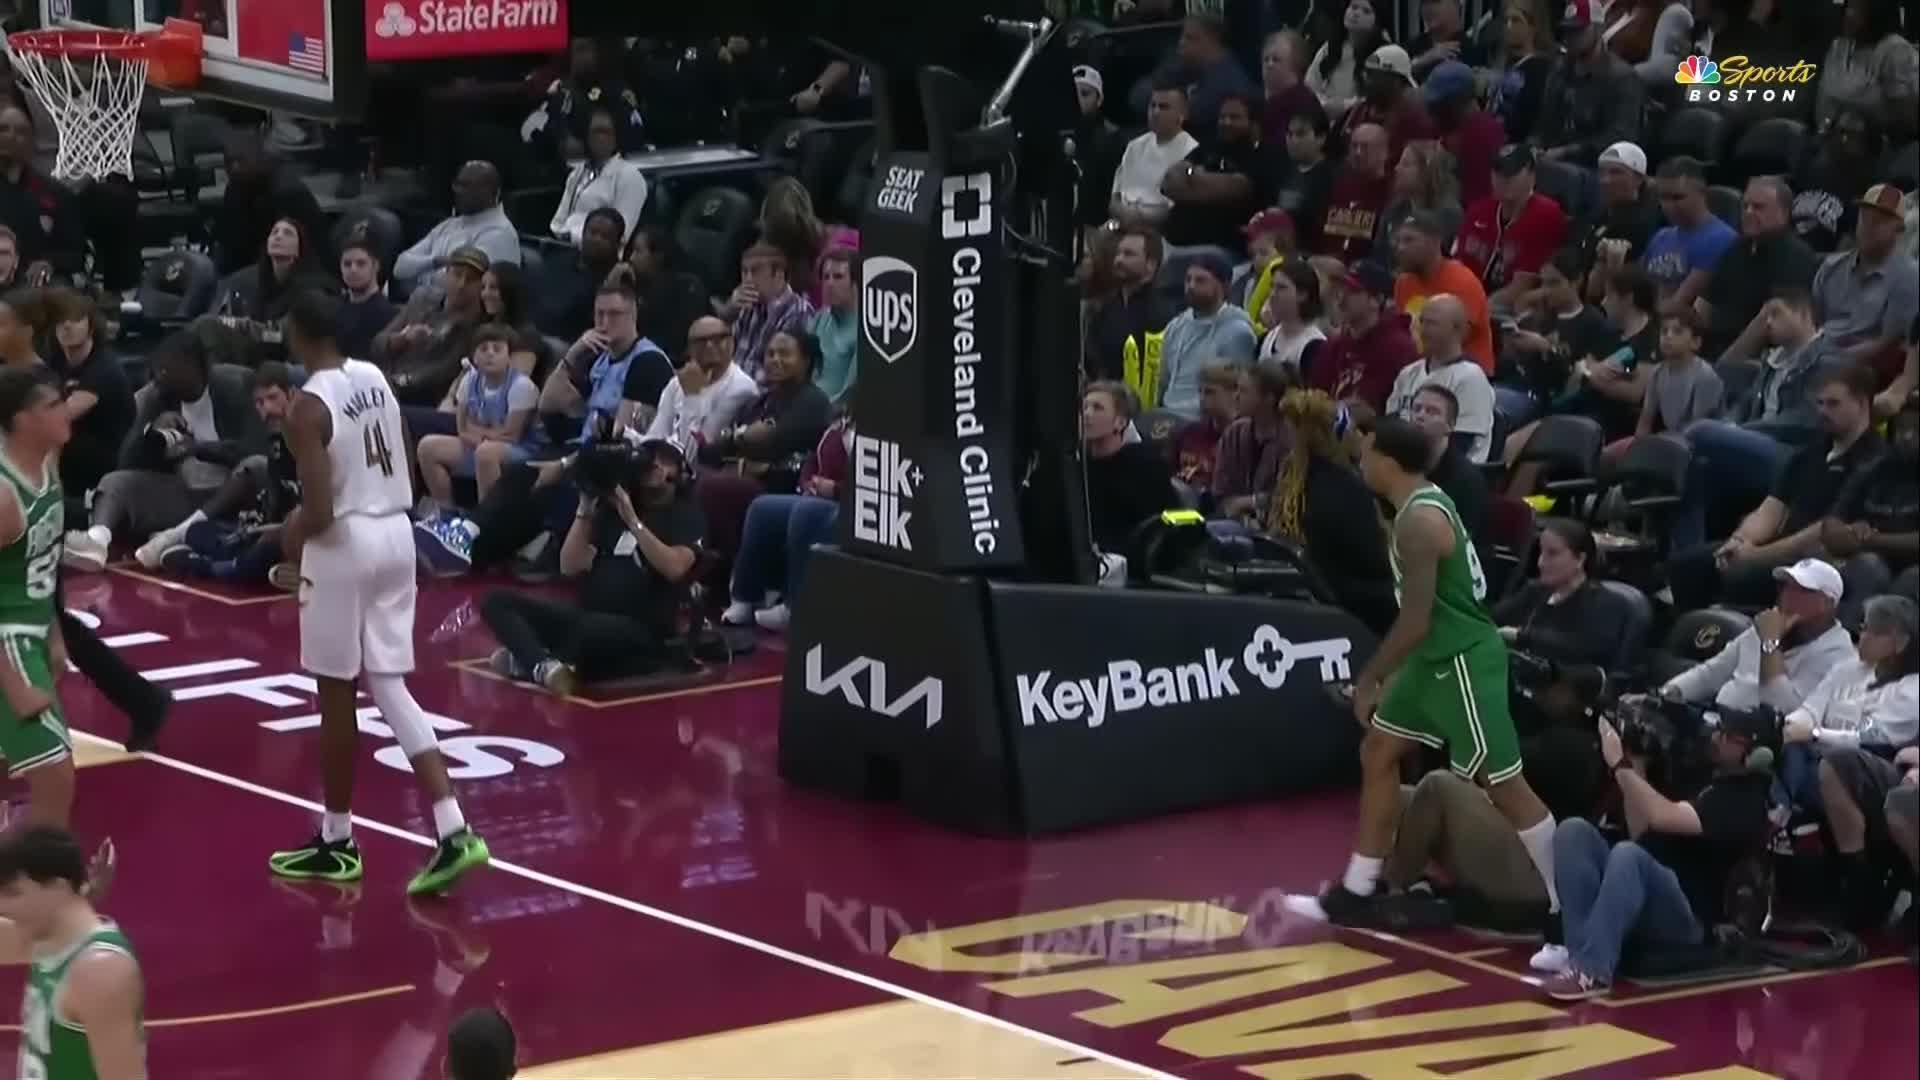
| Oct 8 | Preseason | BOS vs CLE ↗ | 24.5 | 17 | 5 | 3 | 2 | 0 | 55.6% | 33.3% | 100.0% | +3.8Box only · provisional |
No games match these filters.
Shooting percentages use recorded attempts; no attempts is unavailable. Game contribution is not player strength or points caused.
Preseason
Oct 8, 2026 · BOS vs CLE
Bench · 24.5 minutes
A player write-up is not available for these statistics yet.
A matching component breakdown is not published for this rating. Missing components are not zero.
Box only · provisional · Calculated Oct 13, 2026 · 09:31 UTC. Game contribution is not player strength or points caused.
07 / The player file
Signed on 09/14/26
Biography source · ESPN ↗The contract
2026-27 reported base salary
Reported base salary. Guarantees and trade restrictions are unverified.
HoopsHype · checked 2026-10-20 ↗· Contract conversion · BOS Source ↗
Keep exploring
 Derrick White
 Jayson Tatum
 Mitchell Robinson
 Payton Pritchard
 Chris Cenac Jr.
 Paul George