Rebound production
8.2 REB / 36 places Jeremy Sochan at the 76th percentile among all qualified players, across positions. Look at who handles the box-out and which rebounds are contested before assigning the full credit.
Inspect the record ↓Current team unconfirmed
NBA player
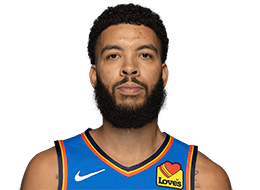
Inside the game of Jeremy Sochan.
 PORTRAIT / NBA NBA PLAYER
Last completed season · 2025-26
44 games · NYK / SAS2026-27 No verified regular-season sample yet. The numbers above describe 2025-26; preseason is separate below.
NBA game-log minutes are rounded; season averages may differ slightly from the league’s full-precision totals.
The morning read
Every game from the night before in one email, with quarter scores, how long each team led and the top players by Game impact.
You're in.
The morning read goes to at 8 a.m. Eastern after the next night of games.
Free. Unsubscribe in one click. Join 671 people who have already signed up.
The scouting lab / 20 skills. Every angle.
Find the shape of Sochan’s game. Explore every skill, put the numbers in league context, then place another player alongside him.

2025-26 / Regular season
44 games · 10.6 MPG · 468.6 minutes
All axes run from 0 to 100. The halfway ring marks the 50th percentile.
Read the detail
Choose a skill to inspect its value, league baseline and sample. Use the category filters to focus the view.
Statistical neighbors
Compare the whole skill profile.
Closest profiles by equal-weight distance across all 20 skill percentiles. This describes statistical similarity, not the same role, style or ceiling. Lower distance means a closer profile.
ESPN’s Net Points model assigns offensive and defensive credit from game events. These are attributed ESPN estimates, separate from RTG’s Game impact. Adding the two would count shared evidence twice.
Percentiles compare published players in the same season who meet your minutes threshold. Ties receive their midpoint rank. We require at least 20 available values per skill; missing values stay unavailable. The league mean is the arithmetic average of player rates, not the 50th percentile. “League impact spread” sorts by the highest minus lowest rate in that pool. “Player strengths” sorts by percentile, or by rate above the league mean in the Net Points view.
Only source samples reconciled to official NBA identities, games and minutes enter this view. The league pool excludes withheld or unavailable profiles. A subject below your minutes threshold is still shown against the qualifying pool and explicitly marked. A previous-season comparison uses that season’s own pool at the same minutes threshold.
These event-based estimates do not fully measure spacing, off-ball deterrence, screen navigation or defensive assignments. Turnover cost is affected by offensive responsibility. Defensive field-goal credit is a model estimate, not a shooting percentage. A short-sample rank is not an ability forecast.
960.4 ESPN possessions · sample through 2026-04-12 · source checked 2026-11-01 08:07 UTC.
01 / The film room
The official film library
02 / The scouting file
The role. The questions. The person.
The statistical read
League percentiles: 412 players with at least 20 games, 300 minutes and 100 field-goal attempts in 2025-26. Higher means more of the named statistic. Per-36 rates describe production in the recorded role; they do not project starter minutes.
Points per 36 minutes
Assists per 36 minutes; does not measure every advantage created
Rebounds per 36 minutes; role and available rebounds matter
Percentage of field-goal attempts taken from three
Free-throw attempts per 100 field-goal attempts
True shooting percentage, weighted by attempts
Percentiles rank this sample against the season’s qualified NBA players across all positions: at least 20 games, 300 minutes and 100 field-goal attempts. Until enough players reach that in the current season, the previous season’s qualified players are used, and the note above names the season. A player needs 100 minutes and 30 field-goal attempts in the sample to be ranked. Rebounding reflects opportunity as well as skill; assists depend on touches and teammates; shot volume does not measure gravity. True shooting uses aggregate points and attempts, with a 0.44 free-throw multiplier. Per-36 rates use recorded minutes, which may be rounded in historical NBA game logs.
NBA source record ↗8.2 REB / 36 places Jeremy Sochan at the 76th percentile among all qualified players, across positions. Look at who handles the box-out and which rebounds are contested before assigning the full credit.
Inspect the record ↓24.4% from three on 45 attempts. Fewer than 100 attempts leave plenty of room for the percentage to move. Watch the misses and the closeouts, too.
Inspect the record ↓1.90 assists per turnover is a starting point. Rewatch possessions against traps and late-clock pressure; this ratio alone cannot tell you how difficult the passing job was.
Inspect the record ↓A comparison worth investigating
2025-26 rates · Closest standardized profiles across the six measures above, with equal weight. Numerical resemblance says little about defensive assignments, shot difficulty or career ceiling.


The reporting file
Read Sochan’s official biography and the reporting below for the path to the NBA. A reviewed account of upbringing, scouting disagreements and development is not yet in this file.
Official biography ↗Player reporting ↓03 / The numbers
2025-26 regular season · 44 games
Choose a game to see the line. Use the arrow keys to move through the chart.
| Sample | GP | PTS | REB | AST | TS% |
|---|---|---|---|---|---|
| Available games | 44 | 3.6 | 2.4 | 0.9 | 56.3% |
| Last 10 | 10 | 3.7 | 2.6 | 0.9 | 75.4% |
| Last 5 | 5 | 5.8 | 4.2 | 1.4 | 70.7% |
| Off bench | 44 | 3.6 | 2.4 | 0.9 | 56.3% |
The shooting profile
2025-26 · Percentages and attempt volume.
2025-26 / By team
| Team | GP | PTS | REB | AST | FG% | 3P% | FT% |
|---|---|---|---|---|---|---|---|
| NYK | 16 | 2.8 | 2.1 | 0.8 | 56.7% | 20.0% | 80.0% |
| SAS | 28 | 4.1 | 2.6 | 1.0 | 47.5% | 25.7% | 68.8% |
04 / The reading room
Read the Game
Reviewed player analysis appears here as game reports are published.
Open the latest game ↗Every recorded appearance ↓Official player file
Background, career notes and the official player record.
05 / The long view
Points per game · Regular season · Team stints are shown separately where supplied.
| Season | Team | GP | MIN | PTS | REB | AST | STL | BLK | FG% | 3P% | FT% |
|---|---|---|---|---|---|---|---|---|---|---|---|
| 2025-26 | NYK / SAS | 44 | 10.7 | 3.6 | 2.4 | 0.9 | 0.4 | 0.2 | 49.6% | 24.4% | 73.1% |
06 / Every appearance
| Competition | Game | FG% | 3P% | FT% | Game impact | |||||||
|---|---|---|---|---|---|---|---|---|---|---|---|---|
| Oct 16 | Preseason | POR vs GSW ↗ | 12.0 | 6 | 3 | 1 | 0 | 1 | 66.7% | 100.0% | — | — |
| Oct 13 | Preseason | POR vs SAC ↗ | 7.0 | 0 | 2 | 2 | 0 | 0 | 0.0% | 0.0% | — | — |
| Oct 12 | Preseason | POR vs LON ↗ | 20.7 | 8 | 8 | 2 | 1 | 0 | 66.7% | — | — | — |
| Oct 7 | Preseason | POR vs GSW ↗ | 9.3 | 10 | 0 | 0 | 0 | 0 | 66.7% | 100.0% | — | — |
No games match these filters.
Shooting percentages use recorded attempts; no attempts is unavailable. Game impact is in points of margin for one game; a dash means it is not published for that game. It is not a rating of player strength.
Preseason
Oct 16, 2026 · POR vs GSW
Bench · 12.0 minutes
Jeremy Sochan scored 6 points, shooting 66.7% from the field. He added 1 block and 3 rebounds.
Box-score read
Game impact is calculated for regular-season games only.
Preseason
Oct 13, 2026 · POR vs SAC
Bench · 7.0 minutes
Jeremy Sochan scored 0 points, shooting 0% from the field. He added 2 assists and 2 rebounds.
Box-score read
Game impact is calculated for regular-season games only.
Preseason
Oct 12, 2026 · POR vs LON
Bench · 20.7 minutes
Jeremy Sochan scored 8 points, shooting 66.7% from the field. He added 8 rebounds and 1 steal.
Box-score read
Game impact is calculated for regular-season games only.
Preseason
Oct 7, 2026 · POR vs GSW
Bench · 9.3 minutes
Jeremy Sochan scored 10 points, shooting 66.7% from the field.
Box-score read
Game impact is calculated for regular-season games only.
07 / The player file
Biography details are being collected.
Waived by POR on 2026-10-17. Current NBA team not confirmed.
The contract
A dated salary for this player and team is not available in the current contract collection.
· Waived · POR Source ↗
The morning read
Every game in one email: quarter scores, how long each team led and the night's top players by Game impact. Pick a team and its game comes first.
You're in.
The morning read goes to at 8 a.m. Eastern after the next night of games.
Free. One email on mornings after games. Unsubscribe in one click.
Join 671 people who have already signed up.
