The strongest ranking
36.2% #2 of 30
Offensive rebound share.
Houston recover 36.2% of available offensive rebounds. Second chances are a strength in this sample.
2026-27 · Western conference
L1 streak / 7–1 home / 5–4 away
Predictions update at most weekly. Next eligible: 2026-11-27. Simulated range remains unvalidated.
NBA ratings · 17 games through 2026-11-20
The read / 17 games in
Relative to the league. Grounded in this season.
The strongest ranking
Houston recover 36.2% of available offensive rebounds. Second chances are a strength in this sample.
The lowest ranking
65.6% of made field goals are assisted, against 65.1% for the average team. This describes the recorded makes, not every pass that creates an advantage.
The scoreboard test
6–4 in the last 10. Scoring margin is #5 of 30 league-wide. Opponent strength and venue are not adjusted here.
The morning read
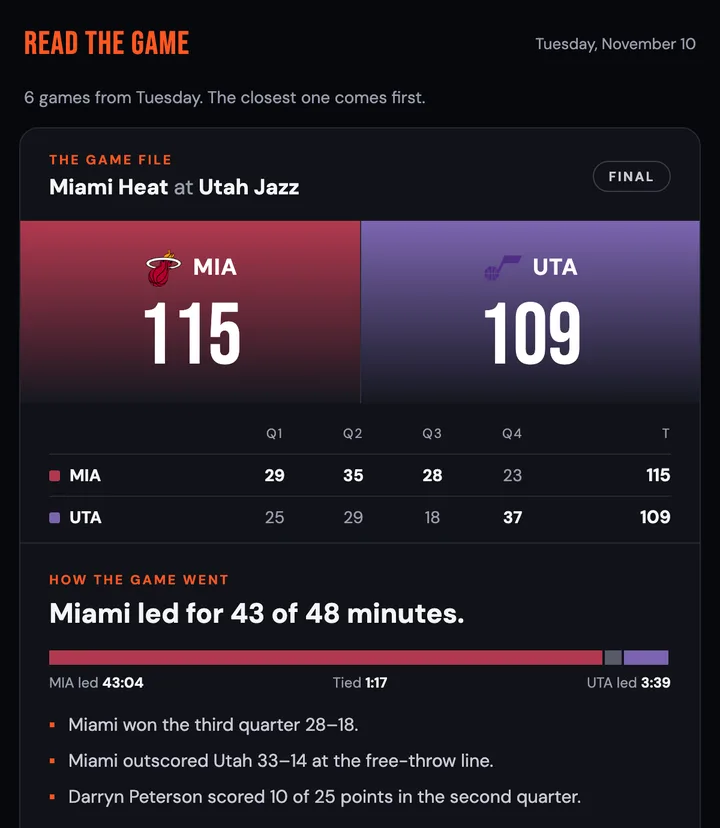
The morning after each game: the score by quarter, how long each team led and the top players by Game impact, then the rest of the night's games. It arrives at 8 a.m. Eastern.
You're in.
The morning read goes to at 8 a.m. Eastern after the next night of games.
Free. Unsubscribe in one click. Join 673 people who have already signed up.
16 of 17 team games scored through 2026-11-20 · 2026-27 regular season
+2.4 impact points per team game against the league’s forwards at the same minutes.
+1.7 against the same-minute benchmark. Every position is above average.
-0.5 points per team game against the position average. See trade targets ↓
| Player | GP | Min / G | Game impact / G |
|---|---|---|---|
| Kevin DurantForward | 16 | 33.7 | +0.2 |
| Jabari Smith Jr.Forward | 16 | 33.5 | +1.5 |
| Alperen SengunCenter | 15 | 33.0 | +2.0 |
| Amen ThompsonGuard | 15 | 32.8 | +1.3 |
| Tari EasonForward | 16 | 24.5 | 0.0 |
| Fred VanVleetGuard | 13 | 30.0 | +1.0 |
| Reed SheppardGuard | 13 | 20.0 | +0.7 |
| Marcus SmartGuard | 11 | 21.2 | +0.4 |
| Bogdan BogdanovićGuard | 16 | 12.2 | -0.5 |
| Oscar TshiebweForward | 10 | 6.5 | +0.6 |
| Clint CapelaCenter | 5 | 12.7 | -0.3 |
| Isaiah CrawfordForward | 10 | 6.0 | +0.7 |
| Steven AdamsCenter | 4 | 12.2 | 0.0 |
| Bruce ThorntonGuard | 10 | 3.8 | -0.7 |
| Jae'Sean TateForward | 9 | 3.7 | -0.4 |
NBA roster position on the game date determines each group. A guard-forward counts at guard. Game impact divides the final margin among the players who appeared. The frontcourt combines forward and center totals. Each unit’s denominator is the team’s scored games.
For the positional comparison, we apply the league’s impact per minute at each position to the minutes Houston played there. The biggest need is the largest shortfall in scoring, playmaking, rebounding or recorded defensive plays. The team-result share also counts toward overall impact. Model card ↗
Reported cap hit $202.23M · $37.27M over the cap · $6.78M below the first apron · $19.45M below the second apron. Hard-capped at the second apron. Cap sheet · 2026-11-22 ↗
Scoring fit · +1.7 recorded scoring points per 48 versus his position’s average. On the value map he ranks #89 in minutes-weighted impact and #211 in salary.
Watchlist only · No cap-room or one-player salary match passed the screen.
Contract details ↗Scoring fit · +0.5 recorded scoring points per 48 versus his position’s average. On the value map he ranks #55 in minutes-weighted impact and #232 in salary.
Watchlist only · No cap-room or one-player salary match passed the screen.
Next season’s reported base salary $5.05M · Contract ↗Playmaking fit · +0.3 recorded playmaking points per 48 versus his position’s average. On the value map he ranks #68 in minutes-weighted impact and #212 in salary.
Watchlist only · No cap-room or one-player salary match passed the screen.
Contract details ↗Playmaking fit · +0.8 recorded playmaking points per 48 versus his position’s average. On the value map he ranks #83 in minutes-weighted impact and #140 in salary.
Watchlist only · No cap-room or one-player salary match passed the screen.
Contract details ↗Defensive plays fit · +1.9 recorded defensive plays points per 48 versus his position’s average. On the value map he ranks #59 in minutes-weighted impact and #108 in salary.
Salary match · Tari Eason ($14.05M outgoing) for $14.00M incoming. Houston’s cap hit would fall by $0.05M.
Next season’s reported base salary $14.50M · Contract ↗At each listed position we look for an outside player with positive season Full impact. We prioritize above-average production in the weakest skill of the corresponding guard, forward or center group. Among players with a salary route, we give equal weight to Full impact gained over the outgoing player, impact rank versus salary rank on the map, and skill fit per 48 minutes. Full impact is a season strength estimate. The skill figures use the published Game impact ledger.
We screen both clubs using reported cap hits and apron and hard-cap headroom. Below the first apron, incoming salary must fit cap room or the smaller of 125% of outgoing salary plus $100,000 and outgoing salary plus $7.5M. We leave out two-way deals, listed trade restrictions, recent lottery picks on rookie-scale timelines, and either club’s top two players in minutes per game or minutes-weighted Full impact among rated players. A salary match illustrates the money. A known signing wait moves a match behind current salary fits. Actual availability, trade dates, consent, draft compensation and a final league review can change a deal.
Offense and defense per 100 possessions.
Up and right is better.
Hover or focus a logo to explore. Click or tap to keep it open.
 Houston
Tap a logo for team details. Swipe to explore ↔
NBA ratings · 30 teams. Select a team to see how its ratings change with the schedule adjustment.
Swipe the chart to see the whole league.
Offense Points allowed
Highest rank
Lowest rank
Team stays in view More ratings →
| Rank | Team | Win % | W–L | OFF | DEF | NET |
|---|---|---|---|---|---|---|
| T1 |  Los Angeles Lakers | 82.4% | 14–3 | 119.6 | 113.2 | +6.4 |
| T1 |  Philadelphia 76ers | 82.4% | 14–3 | 115.5 | 112.9 | +2.6 |
| T1 |  San Antonio Spurs | 82.4% | 14–3 | 118.1 | 106.0 | +12.0 |
| T4 | Houston Rockets | 70.6% | 12–5 | 121.1 | 113.2 | +7.9 |
| T4 |  Memphis Grizzlies | 70.6% | 12–5 | 119.9 | 111.0 | +8.9 |
| T4 |  Minnesota Timberwolves | 70.6% | 12–5 | 113.5 | 103.8 | +9.7 |
| 7 |  Boston Celtics | 68.8% | 11–5 | 115.7 | 105.6 | +10.1 |
| 8 |  Detroit Pistons | 66.7% | 10–5 | 114.8 | 109.4 | +5.4 |
| 9 |  Denver Nuggets | 64.3% | 9–5 | 115.5 | 114.4 | +1.1 |
| T10 |  Atlanta Hawks | 62.5% | 10–6 | 113.1 | 110.4 | +2.7 |
| T10 |  New York Knicks | 62.5% | 10–6 | 113.9 | 108.6 | +5.3 |
| T10 |  Oklahoma City Thunder | 62.5% | 10–6 | 113.7 | 109.4 | +4.3 |
| T10 |  Portland Trail Blazers | 62.5% | 10–6 | 115.9 | 110.1 | +5.8 |
| 14 |  Miami Heat | 60.0% | 9–6 | 116.9 | 116.7 | +0.3 |
| 15 |  Dallas Mavericks | 56.2% | 9–7 | 112.4 | 112.8 | -0.4 |
| 16 |  Phoenix Suns | 53.3% | 8–7 | 115.6 | 116.0 | -0.4 |
| 17 |  Cleveland Cavaliers | 52.9% | 9–8 | 117.6 | 115.4 | +2.3 |
| 18 |  Golden State Warriors | 50.0% | 8–8 | 112.8 | 113.9 | -1.2 |
| 19 |  Orlando Magic | 46.7% | 7–8 | 111.8 | 114.0 | -2.2 |
| 20 |  Toronto Raptors | 37.5% | 6–10 | 113.9 | 113.1 | +0.8 |
| 21 |  Washington Wizards | 35.3% | 6–11 | 109.5 | 116.1 | -6.5 |
| 22 |  Indiana Pacers | 31.2% | 5–11 | 110.9 | 114.0 | -3.1 |
| 23 |  New Orleans Pelicans | 27.8% | 5–13 | 111.1 | 118.9 | -7.9 |
| T24 |  Charlotte Hornets | 26.7% | 4–11 | 103.1 | 114.0 | -10.9 |
| T24 |  Chicago Bulls | 26.7% | 4–11 | 110.4 | 118.2 | -7.8 |
| T24 |  LA Clippers | 26.7% | 4–11 | 110.6 | 117.1 | -6.4 |
| 27 |  Brooklyn Nets | 20.0% | 3–12 | 110.8 | 119.0 | -8.2 |
| 28 |  Utah Jazz | 17.6% | 3–14 | 106.9 | 114.6 | -7.7 |
| 29 |  Sacramento Kings | 12.5% | 2–14 | 106.8 | 118.7 | -11.9 |
| 30 |  Milwaukee Bucks | 5.9% | 1–16 | 108.1 | 120.3 | -12.1 |
Ties share rank at displayed source precision. Win-percentage ranks do not apply playoff tiebreakers. Missing or conflicting samples stay unranked.
How the numbers take shape
Each dot is a team. The bright one is Houston.
Hover, focus or tap to see who’s who.
Left to right: low to high. Vertical spacing keeps teams selectable.
Field-goal percentage with extra credit for made threes.
Opponent effective field-goal percentage; lower is better.
Made threes divided by three-point attempts.
Share of field-goal attempts taken from three. Rank measures frequency, not quality.
NBA share of available offensive rebounds recovered.
NBA share of available defensive rebounds recovered.
Free-throw attempts per 100 field-goal attempts.
Made free throws divided by free-throw attempts.
NBA percentage of possessions ending in a turnover; lower is better.
Assists divided by made field goals.
NBA possessions per 48 minutes. Faster is a style, not a quality ranking. Rank measures frequency, not quality.
Points scored minus points allowed per game.
The people behind the profile
Current roster. Production in games for Houston.

Scoring
15 games with HOU ↗
Rebounding
15 games with HOU ↗
Playmaking
15 games with HOU ↗
Player stays in view More stats →
 Alperen SengunC |
+7.45.1 to 9.1 | 15 | 33.0 | 22.1 | 9.3 | 7.0 | 50.0% |
|---|---|---|---|---|---|---|---|
 Kevin DurantF |
+4.83.0 to 6.0 | 17 | 33.5 | 21.0 | 5.2 | 3.8 | 40.0% |
 Clint CapelaC |
+2.21.1 to 3.9 | 6 | 14.2 | 3.2 | 5.2 | 1.7 | — |
 Reed SheppardG |
+1.80.6 to 2.9 | 14 | 19.8 | 9.1 | 1.7 | 2.6 | 34.1% |
 Jabari Smith Jr.F |
+1.3-0.4 to 2.7 | 17 | 33.3 | 15.6 | 6.2 | 2.2 | 40.2% |
 Isaiah CrawfordF |
+1.20.3 to 2.0 | 11 | 5.9 | 2.6 | 1.2 | 0.3 | 45.5% |
 Marcus SmartG |
+0.9-0.1 to 1.7 | 11 | 21.2 | 7.5 | 2.5 | 2.2 | 38.3% |
 Amen ThompsonG-F |
+0.8-0.3 to 1.8 | 16 | 32.8 | 16.1 | 7.1 | 3.1 | 31.2% |
 Fred VanVleetG |
+0.0-0.9 to 1.3 | 14 | 29.9 | 14.4 | 2.9 | 5.7 | 39.2% |
 Steven AdamsC |
+0.0-1.5 to 1.0 | 4 | 12.2 | 4.0 | 4.0 | 1.5 | — |
 Bruce ThorntonG |
-0.2-0.8 to 0.7 | 11 | 3.7 | 1.9 | 0.1 | 0.0 | 33.3% |
 Bogdan BogdanovićG |
-1.7-2.5 to -0.6 | 17 | 12.4 | 5.2 | 1.3 | 1.1 | 43.2% |
 Jae'Sean TateF |
-2.1-2.7 to -1.1 | 10 | 3.8 | 0.7 | 1.0 | 0.4 | 0.0% |
 Oscar TshiebweF-C |
-2.2-3.2 to -1.2 | 11 | 7.7 | 2.8 | 3.3 | 0.8 | — |
 Tari EasonF |
-2.3-3.7 to -0.9 | 17 | 24.9 | 10.4 | 6.1 | 1.5 | 27.4% |
 Julian PhillipsF |
— | 0 | — | — | — | — | — |
 Quadir CopelandG |
— | 0 | — | — | — | — | — |
Try another name or lower the games and minutes filters.
PTS, REB, AST and MIN are per game for this team. Full impact / 48 is the validated season player-strength estimate across teams, with a 90% conditional sampling interval; it is not additive team impact. Model through 2026-11-21. Model & validation ↗
The season leaves a trail
17 results. 6–4 over the last 10.
Oldest to newest · Final scoring margins · Select a game for the full breakdown.
HOU124DEN HOME133HOU119IND HOME104HOU110MIA HOME128HOU147WAS HOME119HOU125UTA AWAY118HOU115GSW AWAY108A current report for this exact matchup has not been published. Absence from this list does not establish availability.
The people building the team
Coaching, development and player care.
Explore the people and their paths.
Head coach
Assistant coach
Assistant coach
Assistant coach
Assistant coach
Assistant coach
Assistant coach
Assistant coach
Assistant coach
Athletic training / support
NBA staff listing observed 2026-11-22. Career biographies may describe earlier appointments. Additional Portland roles are attributed to the linked team and professional-association directories; this is the published basketball staff, not a complete employee directory.
The team file
Caleb McConnell ↗Waived · 2026-10-17
Cameron Matthews ↗Waived · 2026-10-17
Bryce Harris ↗Waived · 2026-10-17
Sean Pedulla ↗Waived · 2026-10-19
Julian Phillips ↗Contract Conversion · 2026-10-19
NBA transaction register ↗Results through 2026-11-20. 17 reconciled team boxes from 17 finals.
NBA ratings · 17 games through 2026-11-20.Checked 2026-11-22 18:44 UTC
Official NBA team stats ↗Stat definitions ↗Calculated 2026-11-22 19:31 UTC. Results use completed regular-season games. Shooting percentages pool attempts; zero attempts remain unavailable. Rankings compare matched complete samples. Average team is an unweighted mean of team rates. NBA rankings can differ when unrounded values break ties.
Roster observation 2026-11-22. Player impact keeps its own model cutoff.
daaf19400f096a22de01ea6b5a95a6eece2ee7d436a42ed375ebfd7cb4e99aca
NBA box · 0022600249 ↗NBA box · 0022600259 ↗NBA box · 0022600050 ↗Schedule-adjusted ratings · 17 games through 2026-11-20
Offense and defense per 100 possessions.
Up and right is better.
Hover or focus a logo to explore. Click or tap to keep it open.
HoustonTap a logo for team details. Swipe to explore ↔
Schedule-adjusted ratings · 30 teams. Select a team to see how its ratings change with the schedule adjustment.
Swipe the chart to see the whole league.
Offense Points allowed
Highest rank
Lowest rank
Team stays in view More ratings →
| Rank | Team | Win % | W–L | OFF | DEF | NET |
|---|---|---|---|---|---|---|
| T1 | Los Angeles Lakers | 82.4% | 14–3 | 118.3 | 115.3 | +3.0 |
| T1 | Philadelphia 76ers | 82.4% | 14–3 | 114.9 | 114.1 | +0.8 |
| T1 | San Antonio Spurs | 82.4% | 14–3 | 117.5 | 107.6 | +9.9 |
| T4 | Houston Rockets | 70.6% | 12–5 | 122.0 | 113.4 | +8.6 |
| T4 | Memphis Grizzlies | 70.6% | 12–5 | 118.7 | 112.8 | +5.9 |
| T4 | Minnesota Timberwolves | 70.6% | 12–5 | 113.1 | 103.2 | +9.9 |
| 7 | Boston Celtics | 68.8% | 11–5 | 114.0 | 107.1 | +6.9 |
| 8 | Detroit Pistons | 66.7% | 10–5 | 114.6 | 109.8 | +4.8 |
| 9 | Denver Nuggets | 64.3% | 9–5 | 115.1 | 112.8 | +2.3 |
| T10 | Atlanta Hawks | 62.5% | 10–6 | 111.1 | 111.3 | -0.2 |
| T10 | New York Knicks | 62.5% | 10–6 | 113.8 | 108.4 | +5.4 |
| T10 | Oklahoma City Thunder | 62.5% | 10–6 | 113.1 | 108.3 | +4.8 |
| T10 | Portland Trail Blazers | 62.5% | 10–6 | 116.9 | 109.6 | +7.3 |
| 14 | Miami Heat | 60.0% | 9–6 | 116.9 | 117.6 | -0.7 |
| 15 | Dallas Mavericks | 56.2% | 9–7 | 113.2 | 112.0 | +1.2 |
| 16 | Phoenix Suns | 53.3% | 8–7 | 115.8 | 116.0 | -0.2 |
| 17 | Cleveland Cavaliers | 52.9% | 9–8 | 118.1 | 116.1 | +2.0 |
| 18 | Golden State Warriors | 50.0% | 8–8 | 112.6 | 111.4 | +1.2 |
| 19 | Orlando Magic | 46.7% | 7–8 | 112.4 | 114.9 | -2.5 |
| 20 | Toronto Raptors | 37.5% | 6–10 | 114.6 | 113.0 | +1.6 |
| 21 | Washington Wizards | 35.3% | 6–11 | 109.5 | 116.8 | -7.3 |
| 22 | Indiana Pacers | 31.2% | 5–11 | 109.6 | 113.3 | -3.7 |
| 23 | New Orleans Pelicans | 27.8% | 5–13 | 111.7 | 119.0 | -7.3 |
| T24 | Charlotte Hornets | 26.7% | 4–11 | 102.7 | 113.5 | -10.8 |
| T24 | Chicago Bulls | 26.7% | 4–11 | 112.1 | 117.9 | -5.8 |
| T24 | LA Clippers | 26.7% | 4–11 | 111.0 | 117.2 | -6.2 |
| 27 | Brooklyn Nets | 20.0% | 3–12 | 111.3 | 120.0 | -8.7 |
| 28 | Utah Jazz | 17.6% | 3–14 | 108.0 | 111.8 | -3.8 |
| 29 | Sacramento Kings | 12.5% | 2–14 | 108.2 | 116.1 | -7.9 |
| 30 | Milwaukee Bucks | 5.9% | 1–16 | 109.5 | 118.9 | -9.4 |
Offense, defense and net rating are schedule-adjusted. Ties share rank at displayed source precision. Win-percentage ranks do not apply playoff tiebreakers. Missing or conflicting samples stay unranked.
The morning read
The morning after each game, the Houston Rockets result comes first: quarter scores, how long each team led and the top players by Game impact. The rest of the night's games follow.
You're in.
The morning read goes to at 8 a.m. Eastern after the next night of games.
Free. One email on mornings after games. Unsubscribe in one click.
Join 673 people who have already signed up.