How much should you trust the jumper?
36.4% from three on 500 attempts. Separate catch-and-shoot looks from pull-ups, and open attempts from contested ones, before projecting the percentage.
Inspect the record ↓The historical record · 2013-14
Forward· 6' 8"
Inside the game of Paul George.
 PORTRAIT / NBA FORWARD
2013-14 · Regular season
80 games · INDHistorical teams: IND. Impact and player-strength ratings are awaiting validation.
01 / The film room
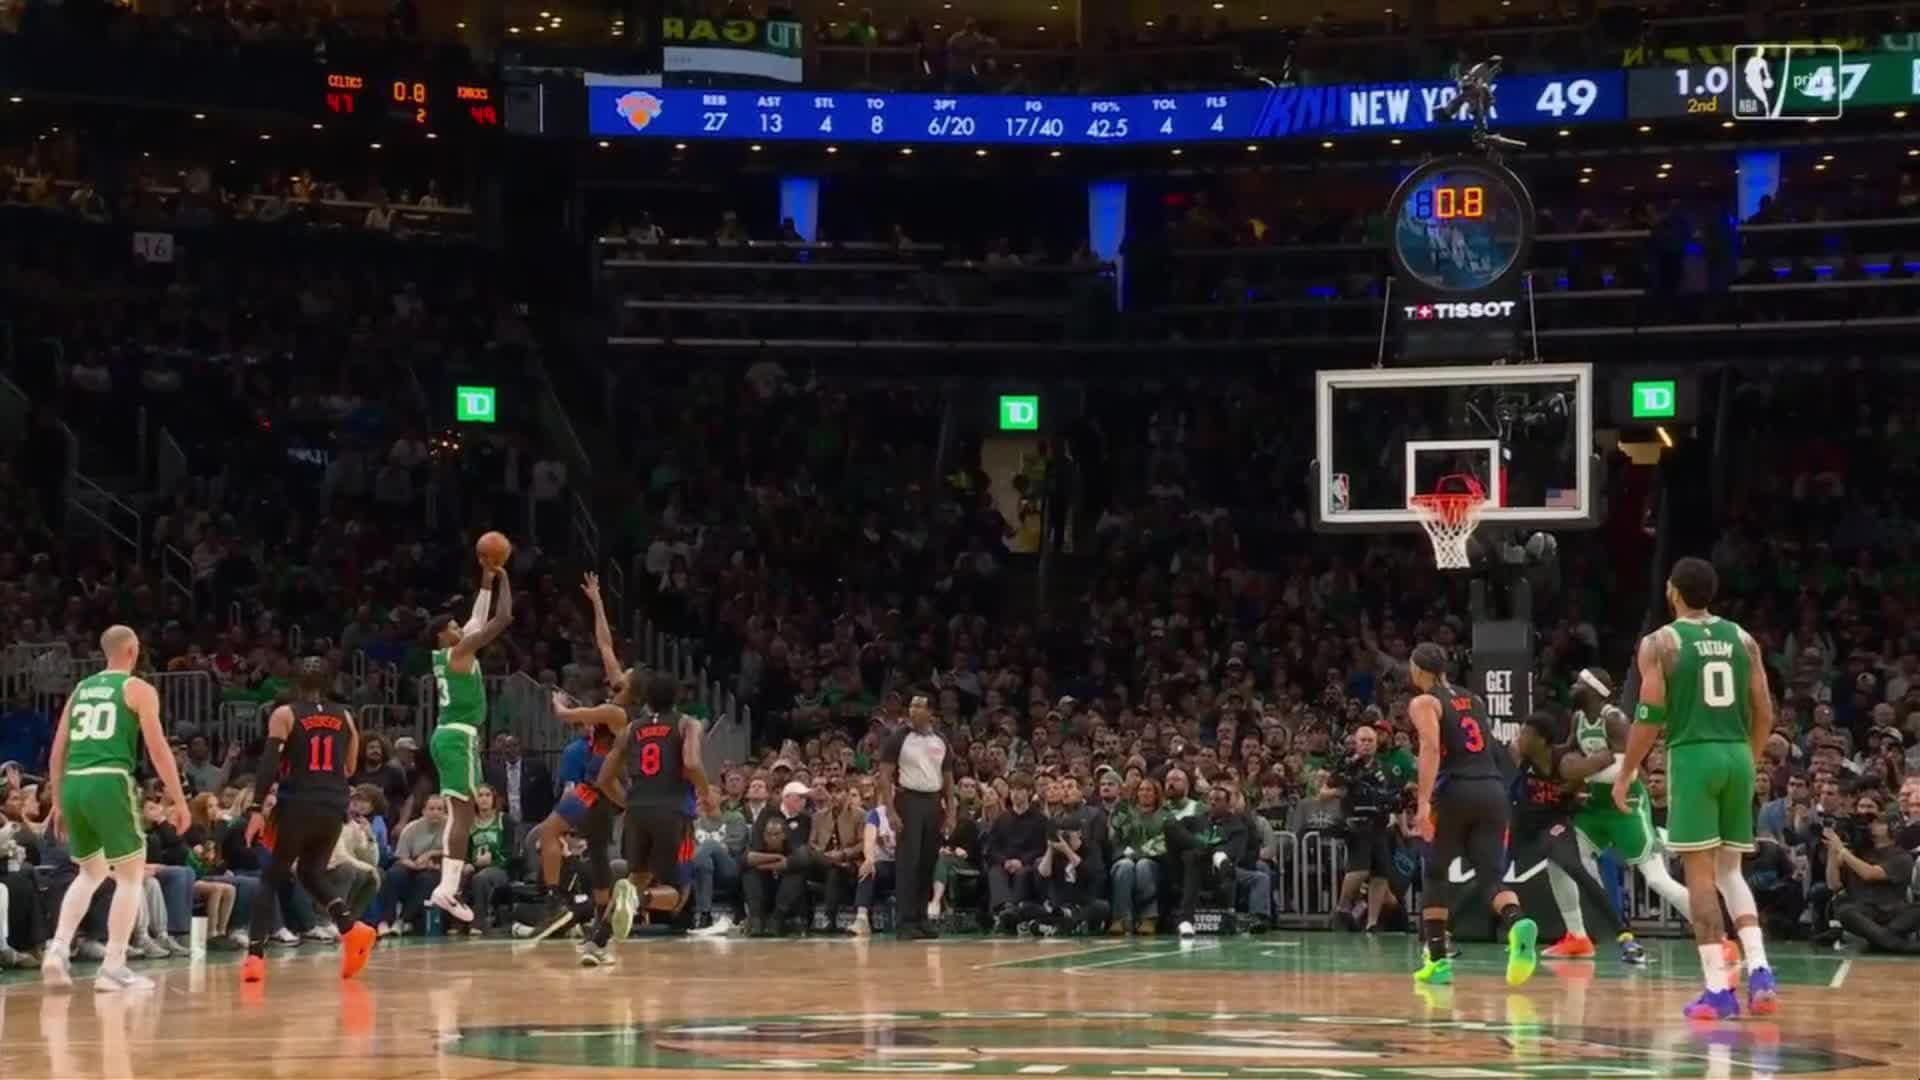 Clip / ESPN
Watch on ESPN
0:21
ESPN · 2026-10-24
Open the full clip with the publisher.
02 / The scouting file
The role. The questions. The person.
The statistical read
No league ranking without a qualified, same-season comparison sample. Per-36 rates describe production in the recorded role; they do not project starter minutes.
Points per 36 minutes
Assists per 36 minutes; does not measure every advantage created
Rebounds per 36 minutes; role and available rebounds matter
Percentage of field-goal attempts taken from three
Free-throw attempts per 100 field-goal attempts
True shooting percentage, weighted by attempts
Percentiles compare this season’s qualified NBA players across all positions. Rebounding reflects opportunity as well as skill; assists depend on touches and teammates; shot volume does not measure gravity. True shooting uses aggregate points and attempts, with a 0.44 free-throw multiplier. Per-36 rates use recorded minutes, which may be rounded in historical NBA game logs.
36.4% from three on 500 attempts. Separate catch-and-shoot looks from pull-ups, and open attempts from contested ones, before projecting the percentage.
Inspect the record ↓1.26 assists per turnover is a starting point. Rewatch possessions against traps and late-clock pressure; this ratio alone cannot tell you how difficult the passing job was.
Inspect the record ↓The reporting file
Read George’s official biography and the reporting below for the path to the NBA. A reviewed account of upbringing, scouting disagreements and development is not yet in this file.
Official biography ↗Player reporting ↓03 / The numbers
2013-14 regular season · 80 games
The shooting profile
2013-14 · Percentages and attempt volume.
04 / The reading room
Read the Game
Reviewed player analysis appears here as game reports are published.
Every recorded appearance ↓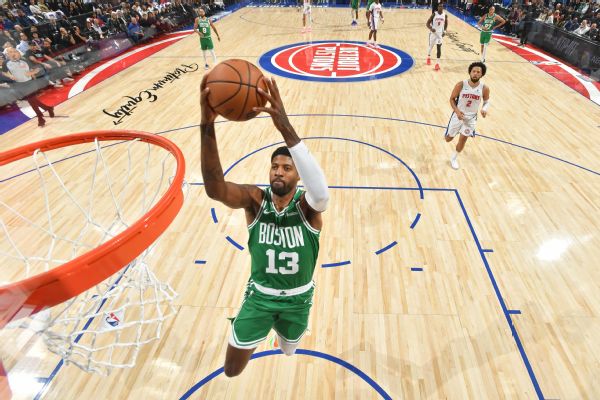


05 / The long view
Points per game · Regular season · Team stints are shown separately where supplied.
| Season | Team | GP | MIN | PTS | REB | AST | STL | BLK | FG% | 3P% | FT% |
|---|---|---|---|---|---|---|---|---|---|---|---|
| 2026-27 | BOS | 2 | 32.0 | 26.5 | 6.0 | 2.5 | 3.5 | 0.0 | 50.0% | 52.6% | 87.5% |
| 2025-26 | PHI | 37 | 30.7 | 17.3 | 5.3 | 3.6 | 1.7 | 0.4 | 43.9% | 39.2% | 82.0% |
| 2024-25 | PHI | 41 | 32.5 | 16.2 | 5.3 | 4.3 | 1.8 | 0.5 | 43.0% | 35.8% | 81.4% |
| 2023-24 | LAC | 74 | 33.8 | 22.6 | 5.2 | 3.5 | 1.5 | 0.5 | 47.1% | 41.3% | 90.7% |
| 2022-23 | LAC | 56 | 34.6 | 23.8 | 6.1 | 5.1 | 1.5 | 0.4 | 45.7% | 37.1% | 87.1% |
| 2021-22 | LAC | 31 | 34.7 | 24.3 | 6.9 | 5.7 | 2.2 | 0.4 | 42.1% | 35.4% | 85.8% |
| 2020-21 | LAC | 54 | 33.7 | 23.3 | 6.6 | 5.2 | 1.1 | 0.4 | 46.7% | 41.1% | 86.8% |
| 2019-20 | LAC | 48 | 29.6 | 21.5 | 5.7 | 3.9 | 1.4 | 0.4 | 43.9% | 41.2% | 87.6% |
| 2018-19 | OKC | 77 | 36.9 | 28.0 | 8.2 | 4.1 | 2.2 | 0.4 | 43.8% | 38.6% | 83.9% |
| 2017-18 | OKC | 79 | 36.6 | 21.9 | 5.7 | 3.3 | 2.0 | 0.5 | 43.0% | 40.1% | 82.2% |
| 2016-17 | IND | 75 | 35.9 | 23.7 | 6.6 | 3.3 | 1.6 | 0.4 | 46.1% | 39.3% | 89.8% |
| 2015-16 | IND | 81 | 34.8 | 23.1 | 7.0 | 4.1 | 1.9 | 0.4 | 41.8% | 37.1% | 86.0% |
| 2014-15 | IND | 6 | 15.2 | 8.8 | 3.7 | 1.0 | 0.8 | 0.2 | 36.7% | 40.9% | 72.7% |
| 2013-14 | IND | 80 | 36.2 | 21.7 | 6.8 | 3.5 | 1.9 | 0.3 | 42.4% | 36.4% | 86.4% |
| 2012-13 | IND | 79 | 37.6 | 17.4 | 7.6 | 4.1 | 1.8 | 0.6 | 41.9% | 36.2% | 80.7% |
| 2011-12 | IND | 66 | 29.7 | 12.1 | 5.6 | 2.4 | 1.6 | 0.6 | 44.0% | 38.5% | 80.2% |
| 2010-11 | IND | 61 | 20.7 | 7.8 | 3.7 | 1.1 | 1.0 | 0.4 | 45.3% | 29.7% | 76.2% |
06 / Every appearance
| Competition | Game | FG% | 3P% | FT% | Contribution | |||||||
|---|---|---|---|---|---|---|---|---|---|---|---|---|
| Game data will appear as the season unfolds. | ||||||||||||
No games match these filters.
Shooting percentages use recorded attempts; no attempts is unavailable. Game contribution is not player strength or points caused.
07 / The player file
The contract
A dated salary for this player and team is not available in the current contract collection.